Resolution source will be the JSON from VISHOP https://ads.nipr.ac.jp/vishop/#/extent from which I will compute the mean for March 2026 when the entire month's data comes in.
In the very unlikely event that it ends up exactly on a bin edge (i.e. 14.0000000), the bin edges will be interpreted as [low, high).
Question will resolve once March 2025 data from VISHOP becomes available.
If data is still unavailable by end of April I will consider N/A'ing the market. I'll leave the market open.
At the moment this market closes on April 15, as an arbitrary cutoff date to keep it open while data is outstanding, but will likely resolve earlier as the data should arrive well before then.
 1,000
1,000People are also trading
In the 18 years 2008 to 2025 the gains from 12th Feb to March average were
1 at -0.22
1 at -0.16
14 in range +0.14 to +0.56
1 at +0.63
1 at +0.69
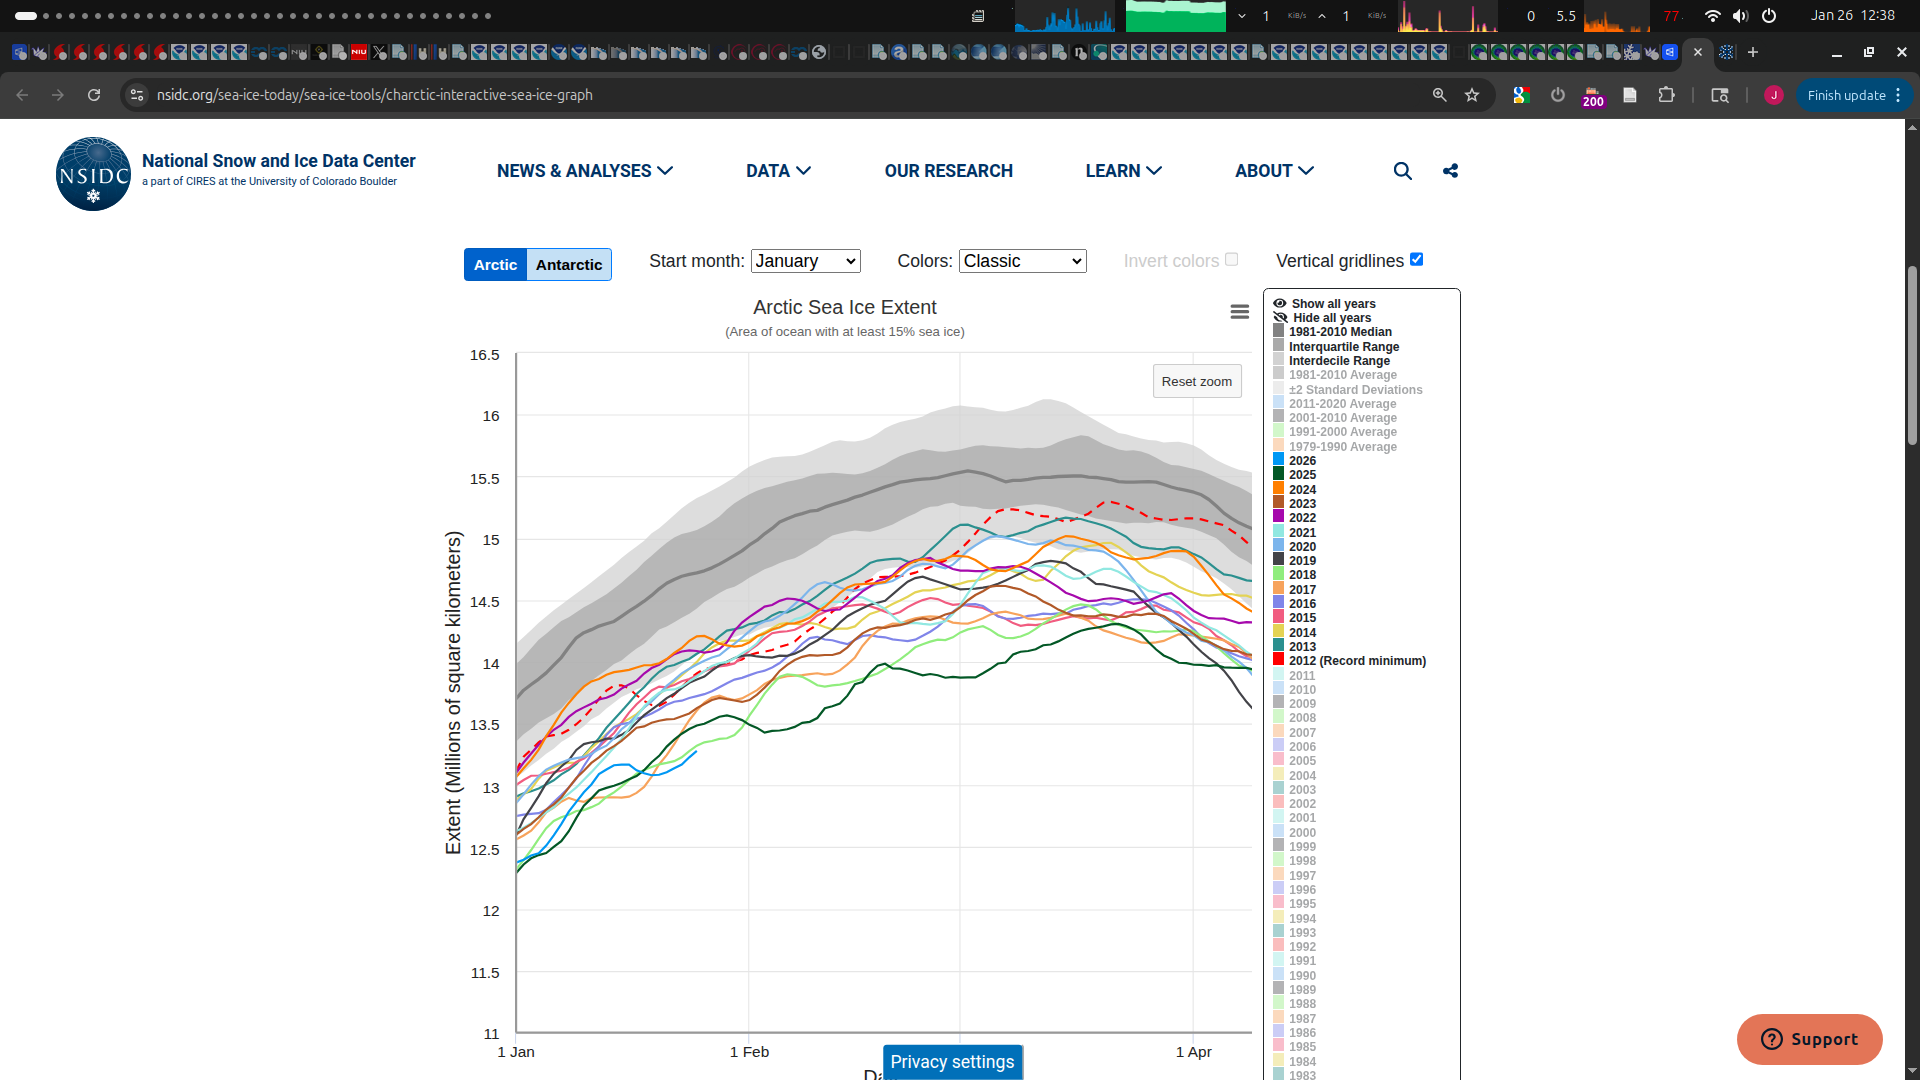
Value is 13.57 on 12 Feb 2026 so roughly, before considering weather or other data, a 14 in 18 chance of being in range 13.71 to 14.13
Perhaps the low side tail stretches further while the high side tail is initially fatter but tails off faster and doesn't stretch as far? There is only 3 of 14 above the midpoint of 0.14 to 0.56 gain range.
More catching up of sea ice....
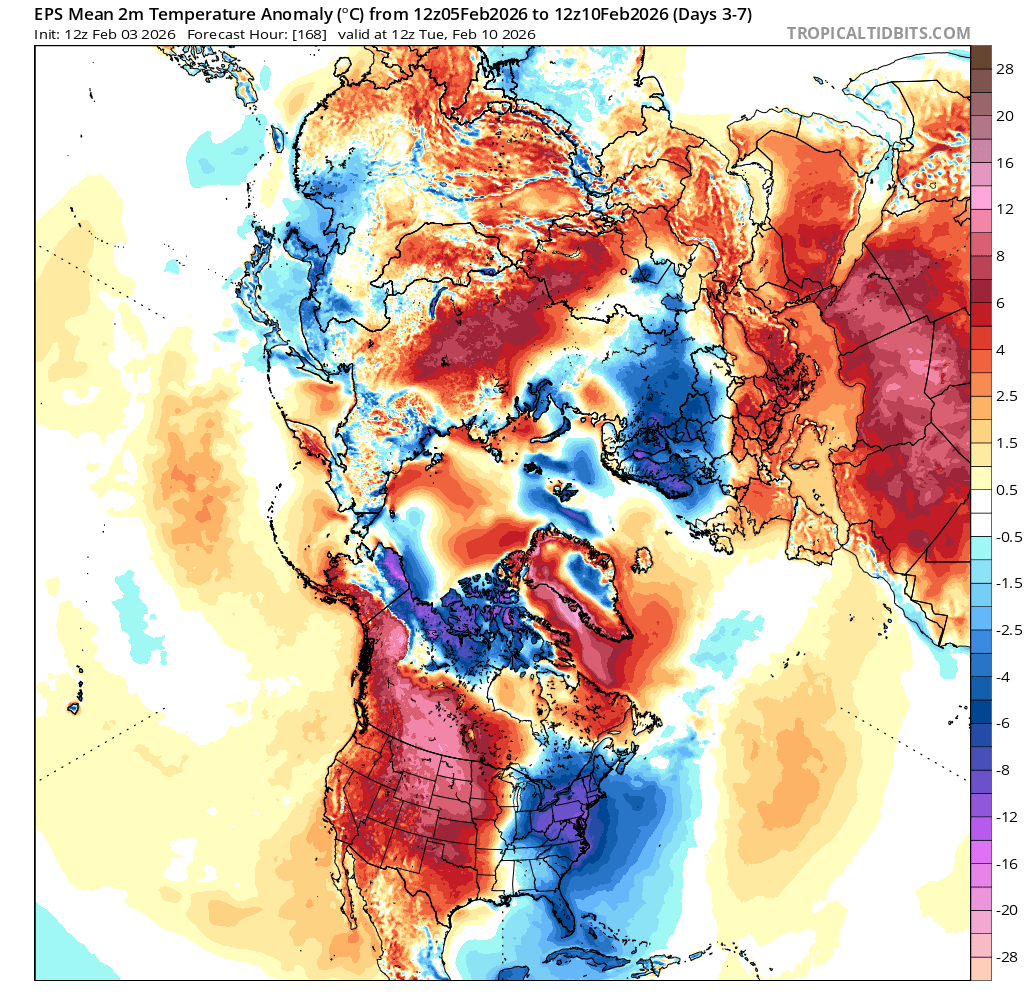
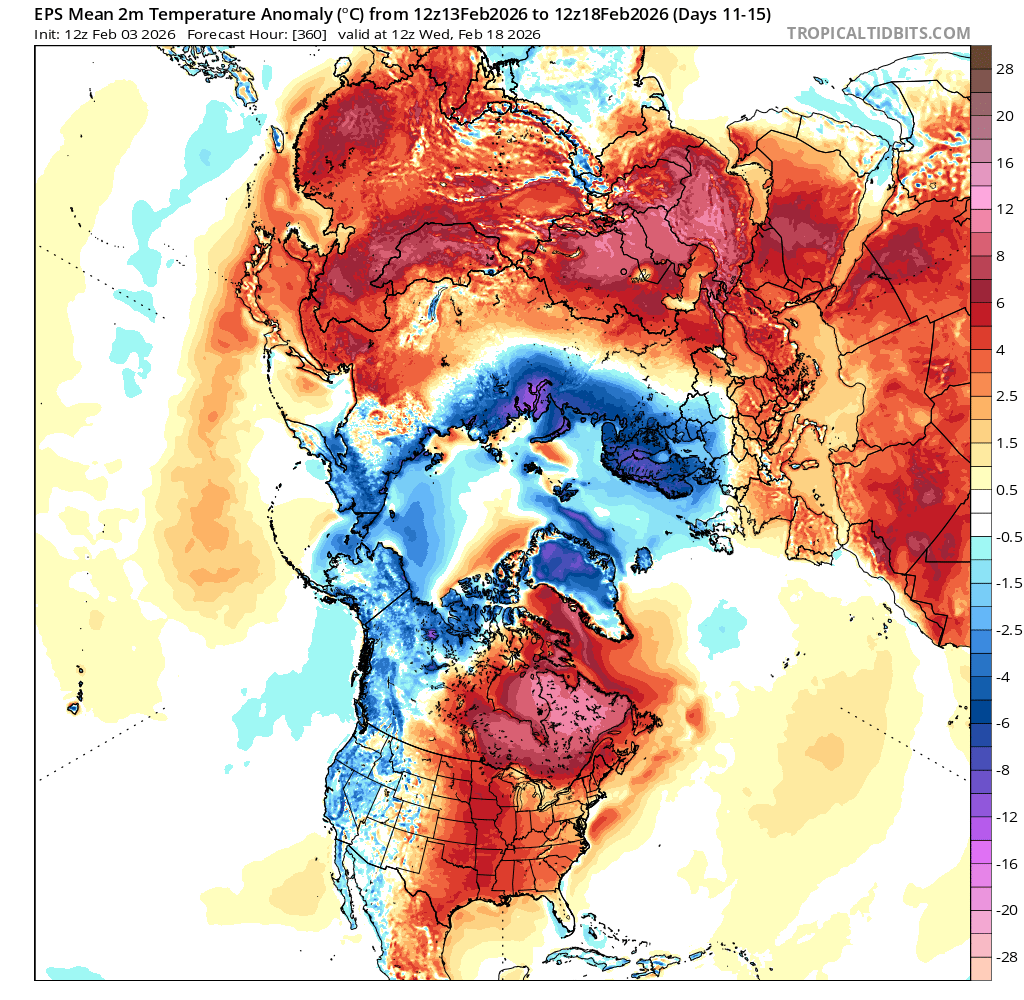
Although warm for the first 10 days of Feb ECM/EPS forecast, it looks more favorable in the middle of February with recent model runs.
Given the abnormal drop in Feb 2025 it looks less likely now that we will end up below 2025 at least for the March mean, and perhaps closer to the 2017, 2018 which would imply around 13.7 million km^2. Although, who knows what might happen in March....
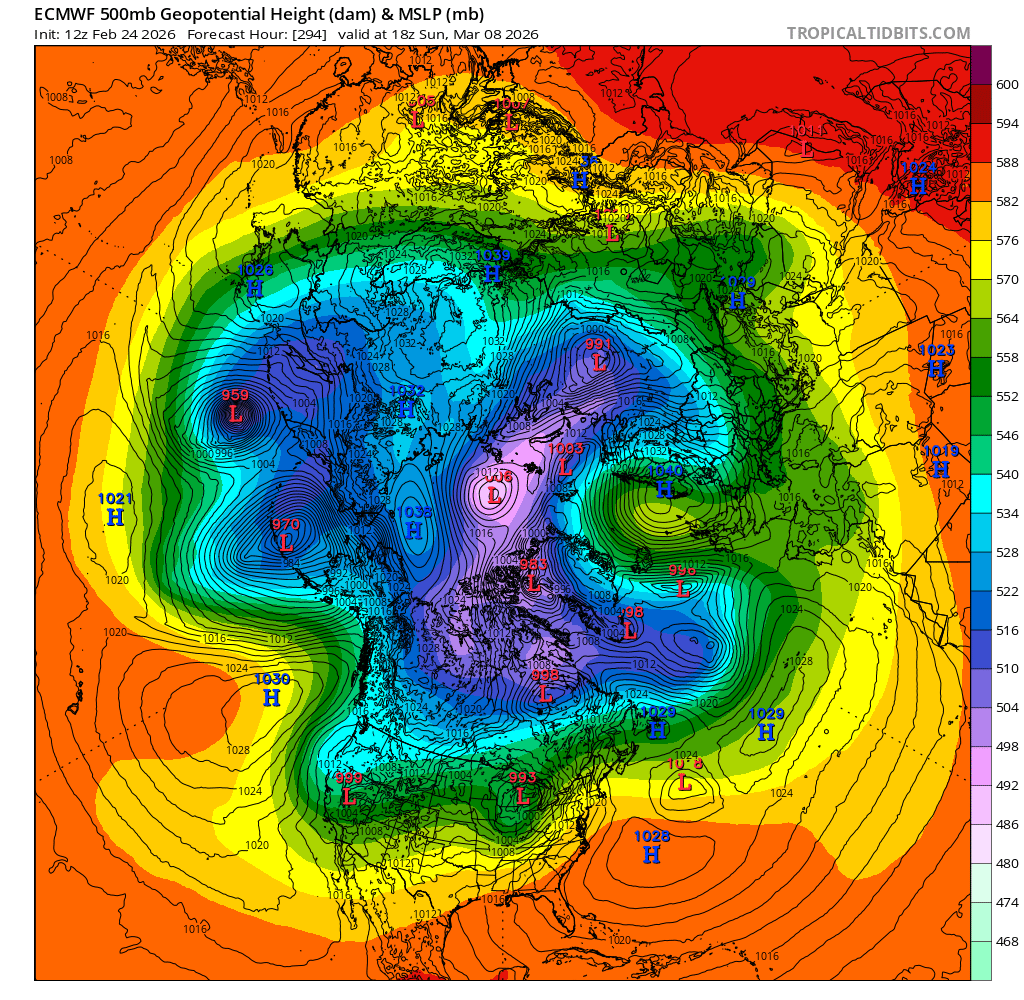
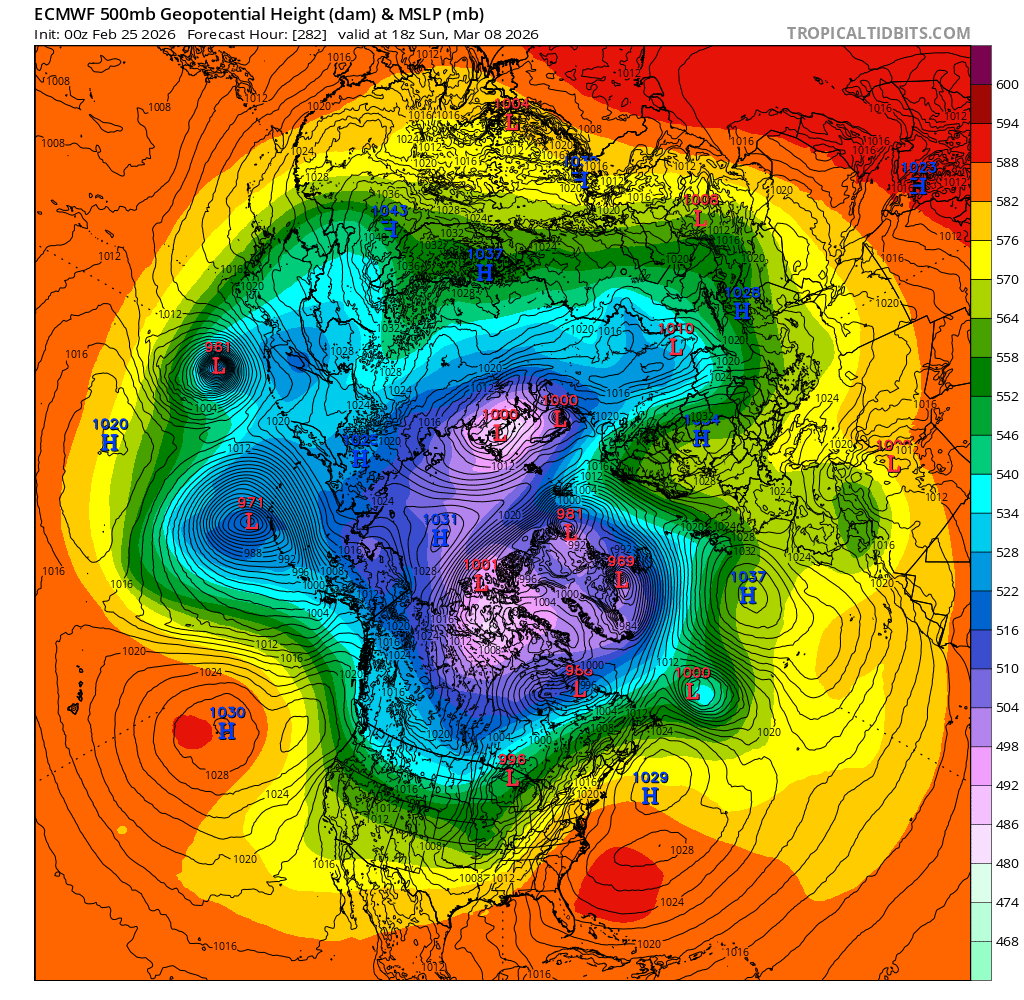
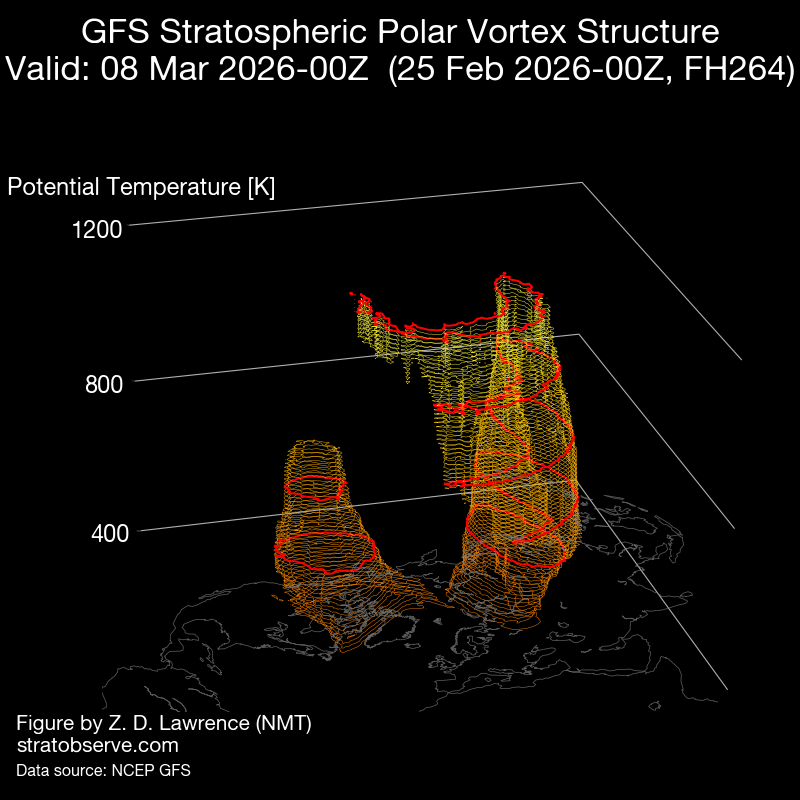
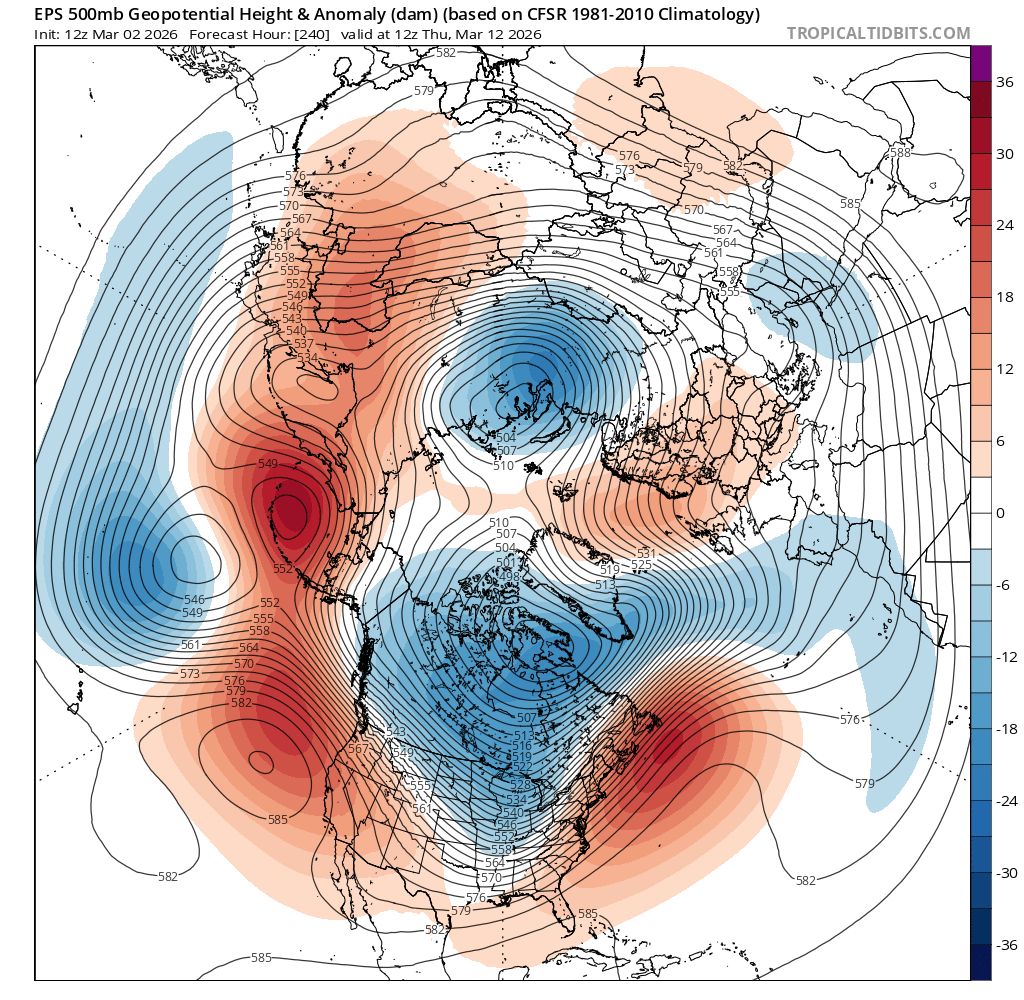
The PV split that may/may not happen after the strat. warming in the next 2-5 days is still uncertain but I'm leaning more towards a stretched vortex. The GFS analysis on stratobserve shows the upper levels of the PV being split while the lower levels keeping coherence, but its still very far out.. GEPS seems less bullish on a PV split from what I can observe. Similarly perhaps for ECMWF and the ensembles as far as I can tell...
@parhizj
The 5 nearest years to the value on 3 Feb 2026 13.29 which were
2018 13.28
2017 13.37
2016 13.37
2023 13.43
2019 13.43
The March average for each of these year ended up 13.68 to 13.97.
Perhaps suggesting that narrow range is likely.
However the 6th nearest 2012 ended up at 14.22.
Perhaps suggesting there is still considerable uncertainty. Should it also be taken to suggest the risk is on the high end?
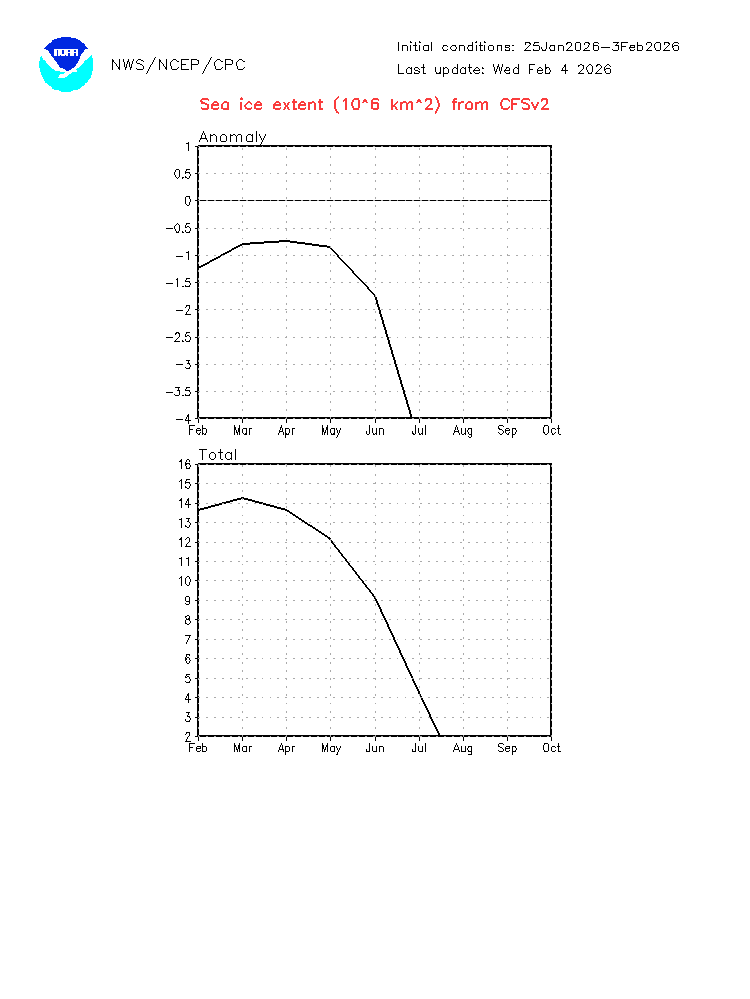
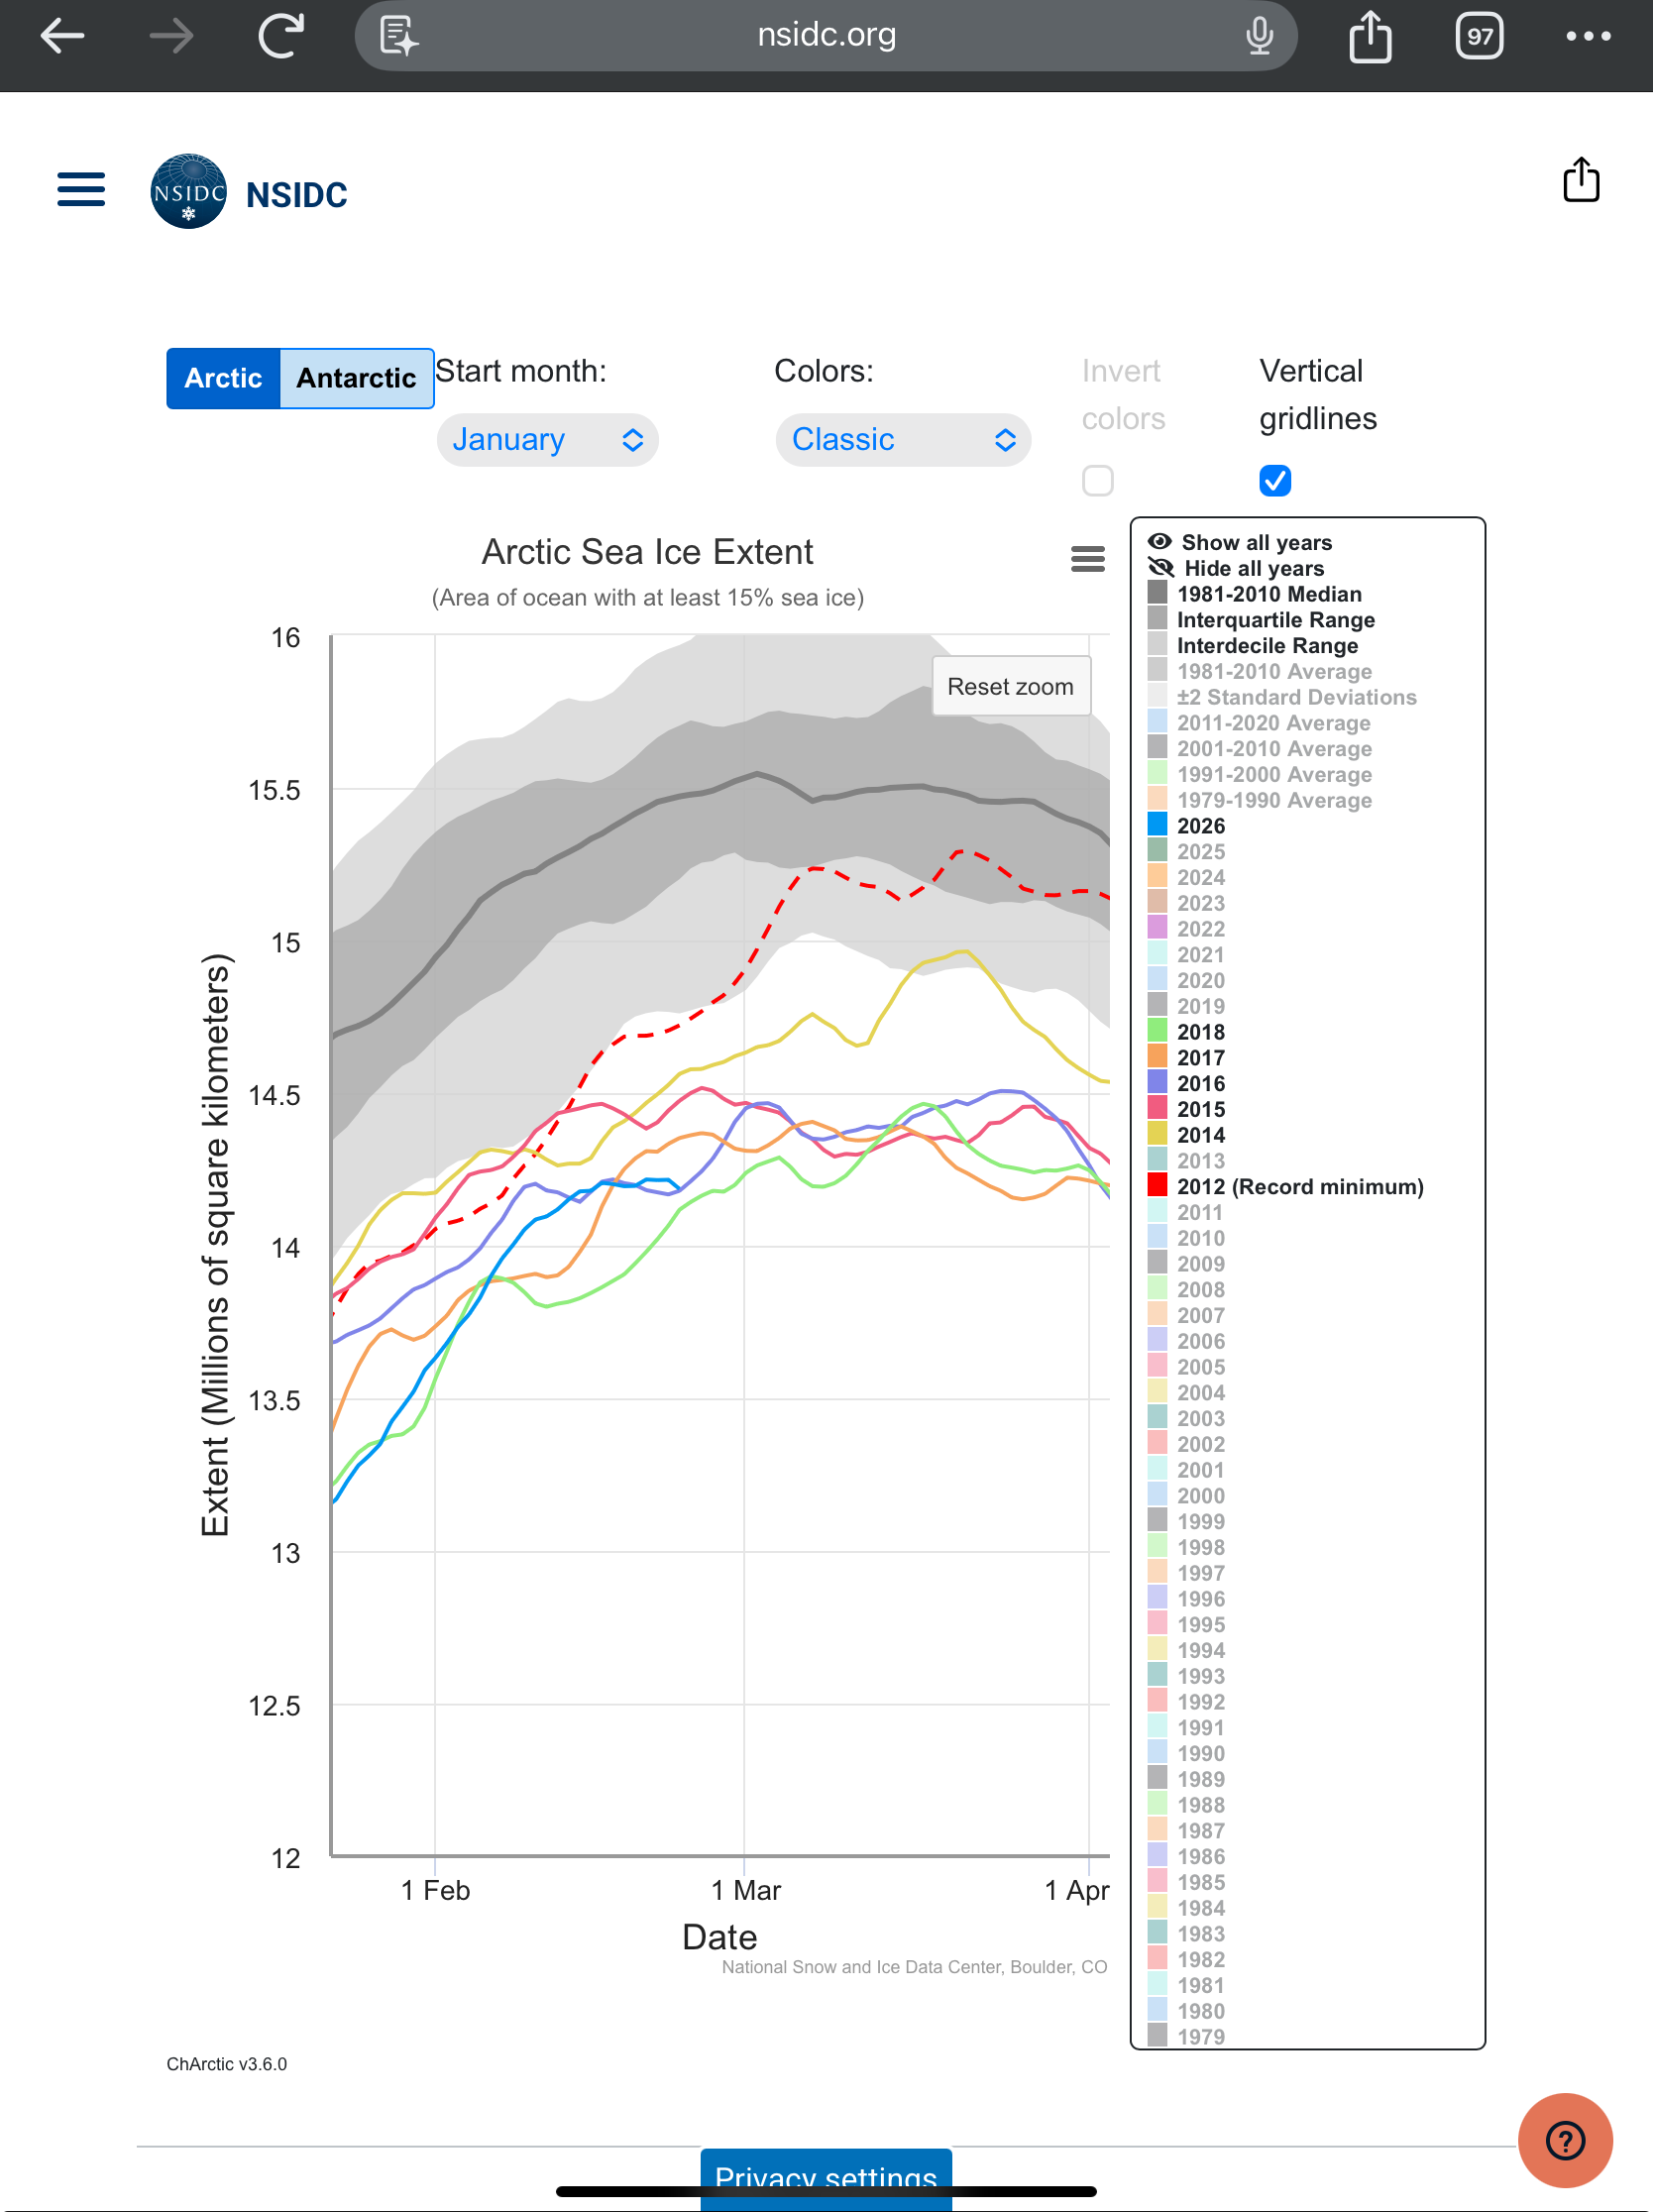
@ChristopherRandles The subseasonal models I recall are fairly good at forecasting sea ice extent one month in advance... The Feb. CFS run for March’s SIE is near ~ 14.2-14.3 which still puts it around ~14 to 14.1 for ViSHOP mean based on my earlier eyeballing.... (hasn't changed much at all)
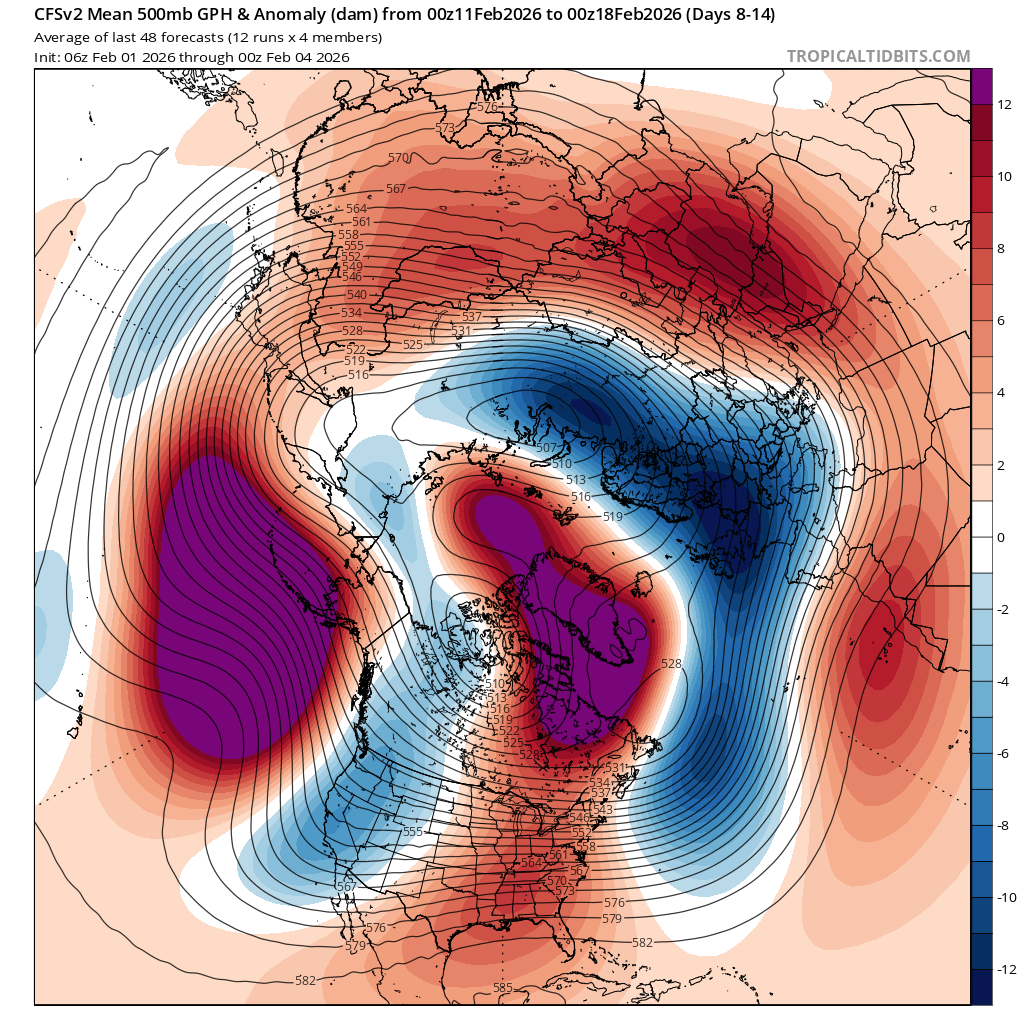
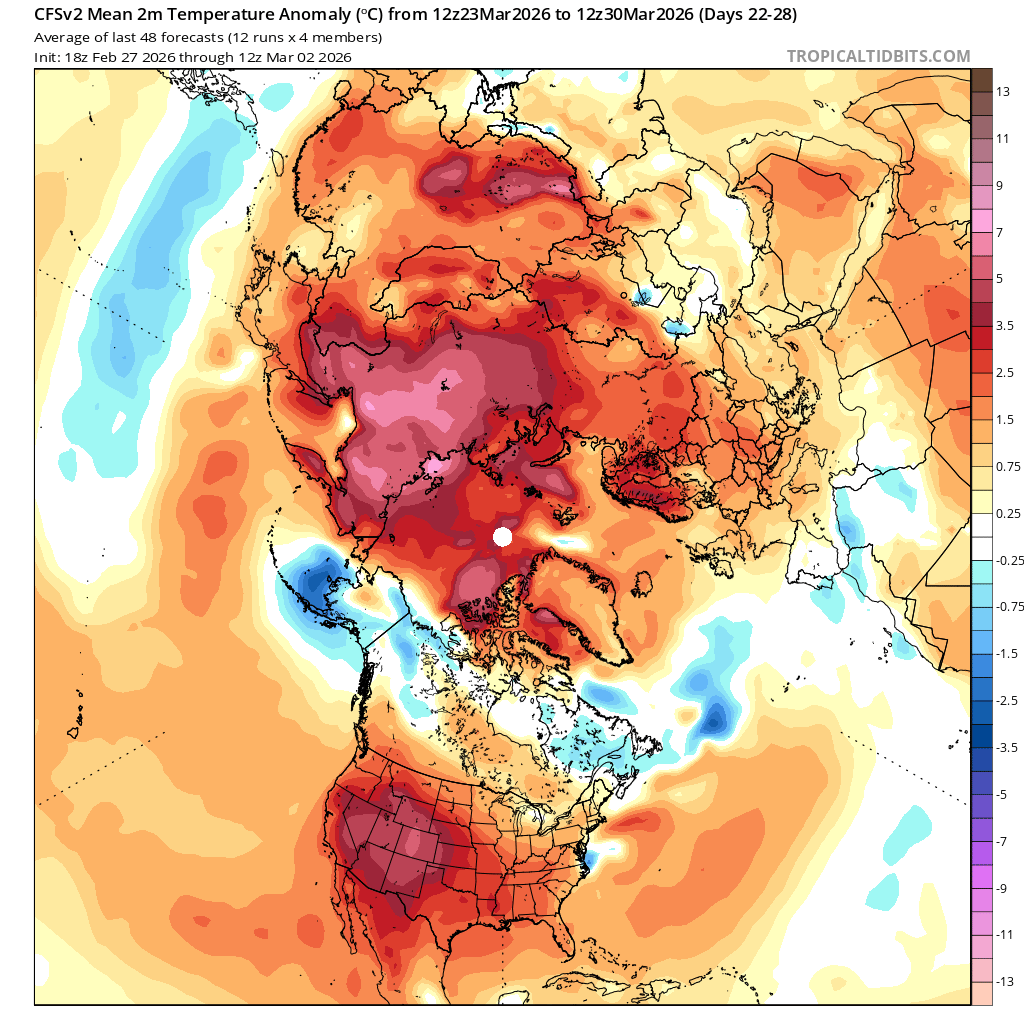
I also went through the 500mb anomaly maps for February from 1991-2025 using PSL's tool, and compared them to some of the subseasonal 500mb anomaly maps for February from tropicaltidbits (CANSIPS, CFS monthly and the more recent CFS weeklies also) . The closest analog seems to be 2007:
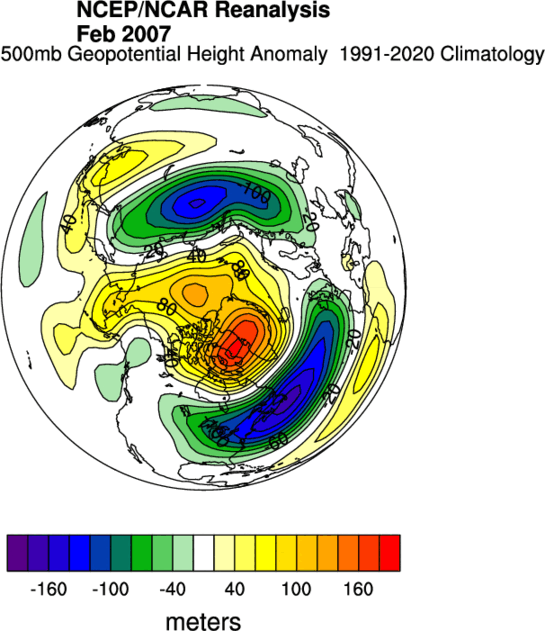
(I'm generally ignoring the difference in datasets and just focusing on the pattern)
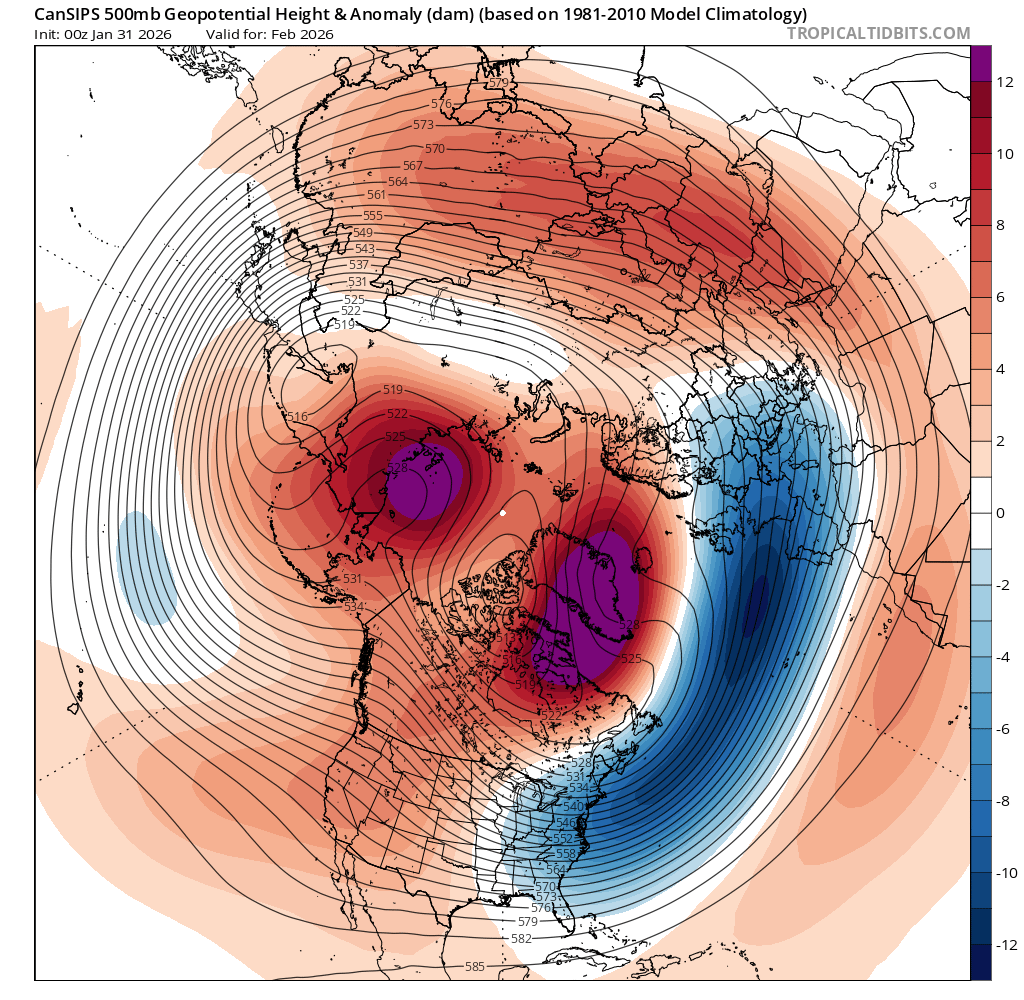
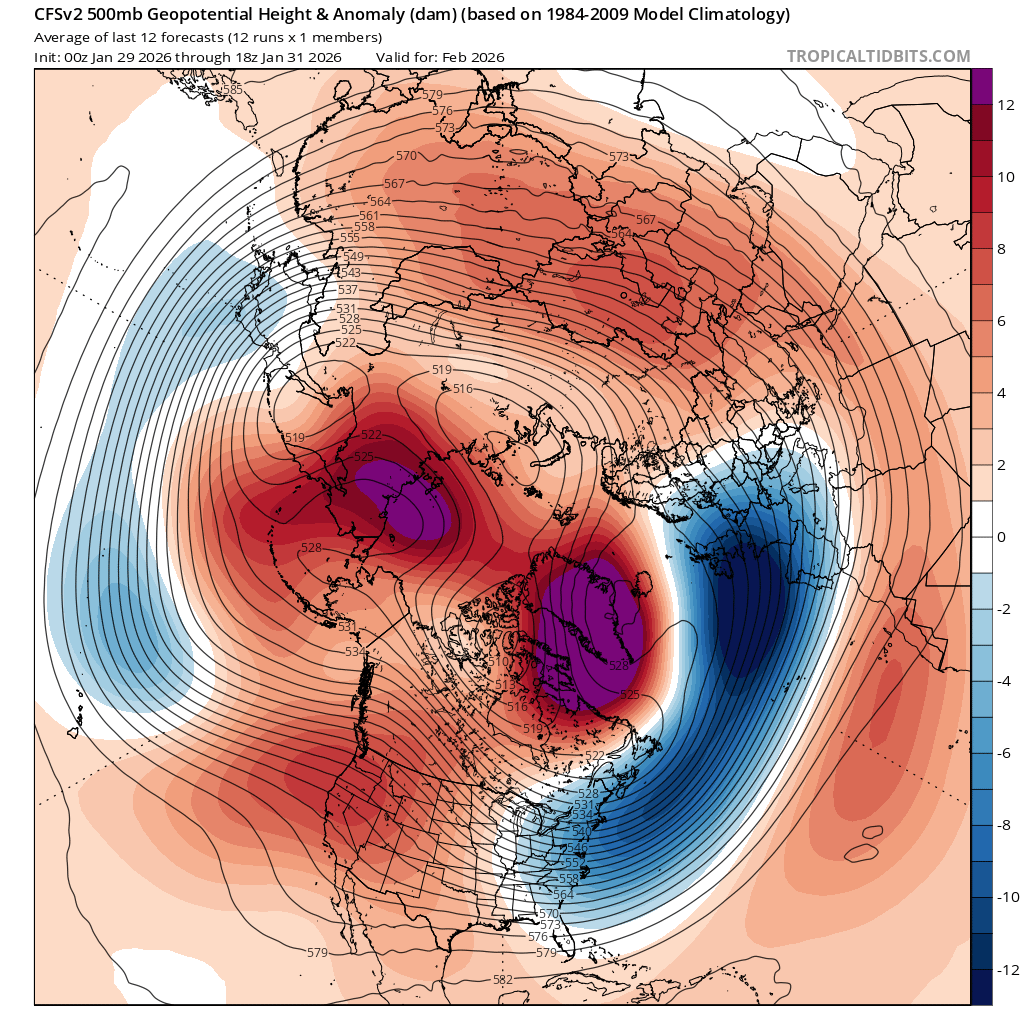
The weekly CFS shows more lows across Northern Russia than the earlier monthlies and a stronger Aleutian high.....
Looking at Feb 1 to Mar 1 daily 2007 from ViSHOP:
(14.11 - 13.79) = 0.32
Looking at your reference years and calculating the same daily differences from Feb 1 to Mar 1..
0.62, 0.50, 0.60, 0.48, 0.76
The mean from these five is then 0.59.
Given that we have had a steady strong rise for the first few days of February and with the conditions for more ice melt last year per the reasons you mentioned below (with faster reversion in this case) I think then 13.2 + 0.32 = 13.52 is probably a fairly good but weak lowerbound for what is reasonable to start off March 1 daily value. The mean of March is usually around 0.04 less then March 1 value, so I think 13.47 then would be a decent monthly lower bound for the mean. If we take the 0.59 value + 13.2 = 13.79 - 0.04 = 13.75 for a middle point prediction.
So yes, I think there is a bit more room for upside given the we still have a high CFS prediction, but subjectively 13.7-13.8 seems like a good bet then if we discount the CFS prediction and rely on these ad hoc methods...
@ChristopherRandles Daily vishop from 2/23 has dropped to 13.488
Still far out when models aren’t considered skillful but the trend has been increasing again for a PV split
in which case it validates I would expect less buildup than usual and more plateau for March overall …
Based on the last daily vishop its between 2018 (13.663) for the date and t 2025 (13.324).
So +0.164 off 2025 and -0.175 off 2018, would be some weak evidence to put it on the lower end of the previous center prediction 20 days ago (13.75). So naively interpolating puts it around 13.63.
This might be on the low side given the recent priors of faster buildup when there is buildup and the CFS prediction.
Edit:
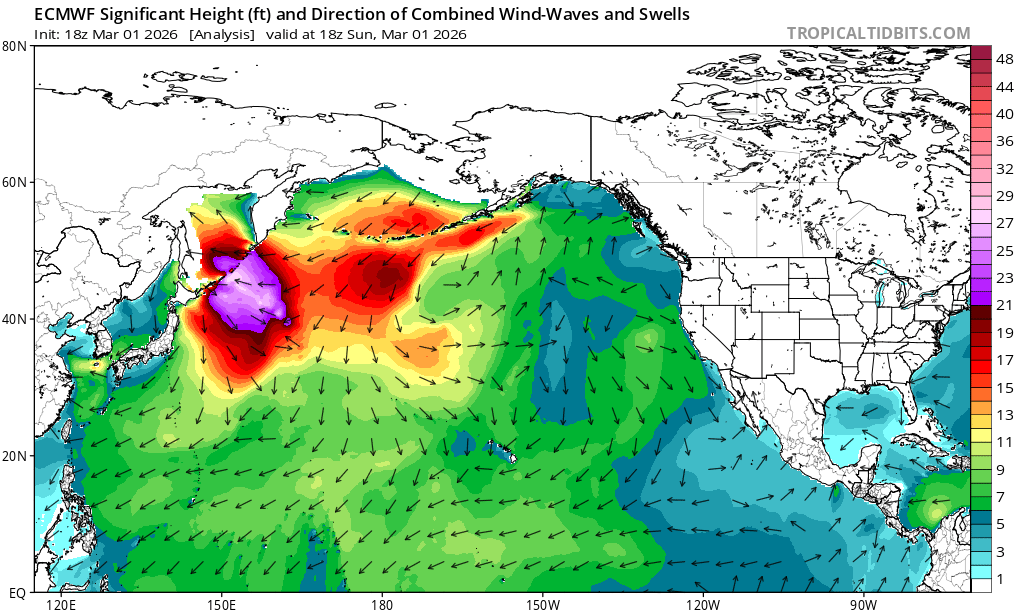
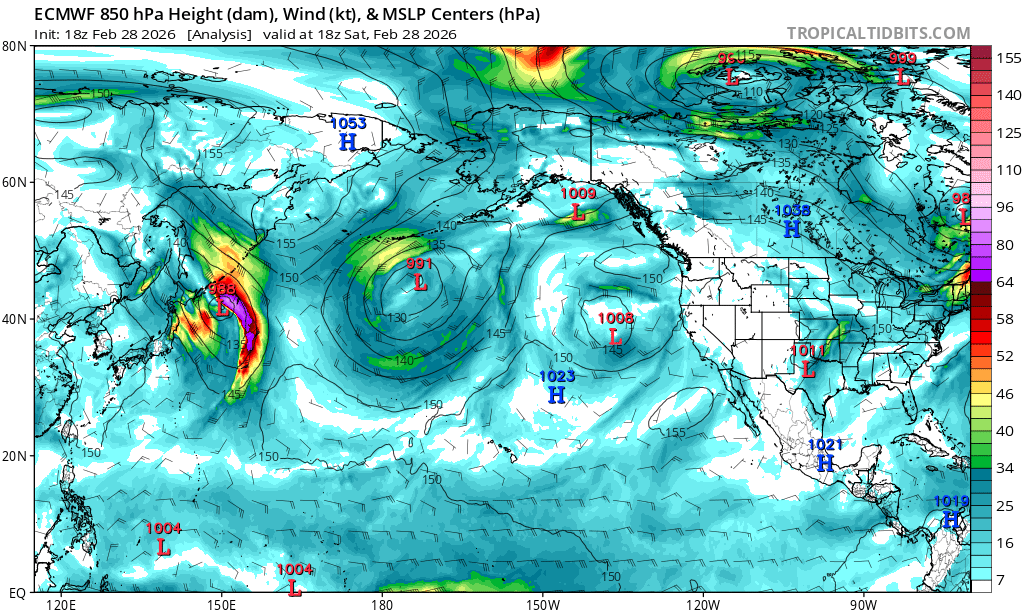
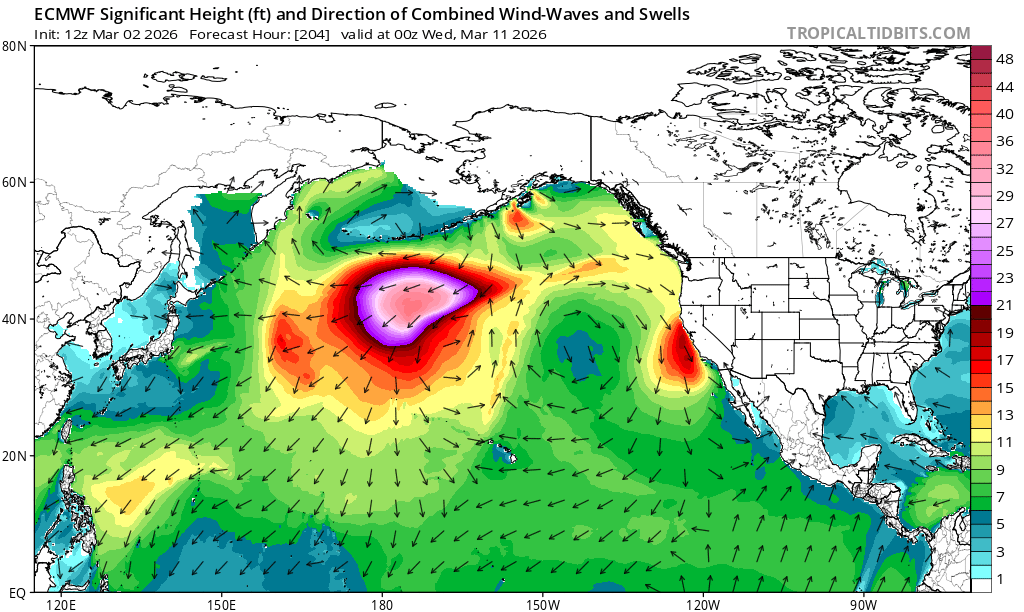
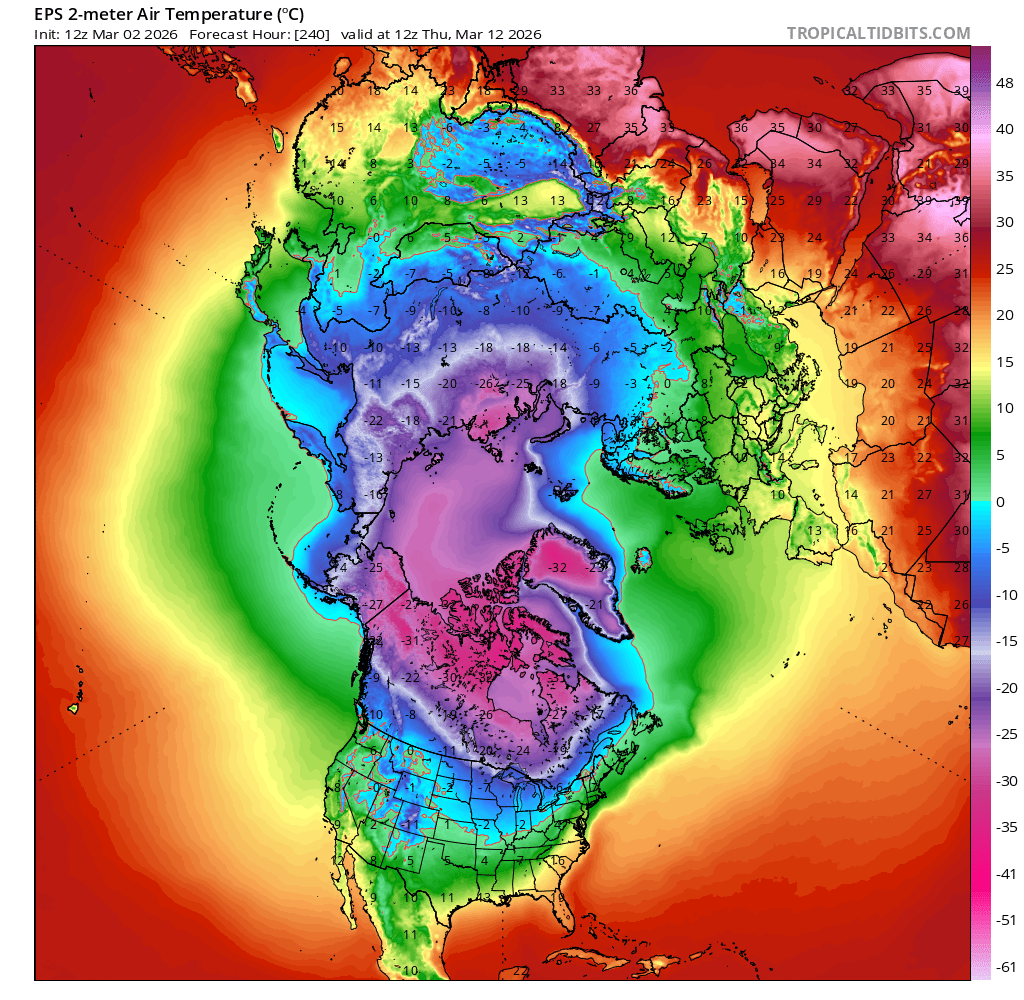
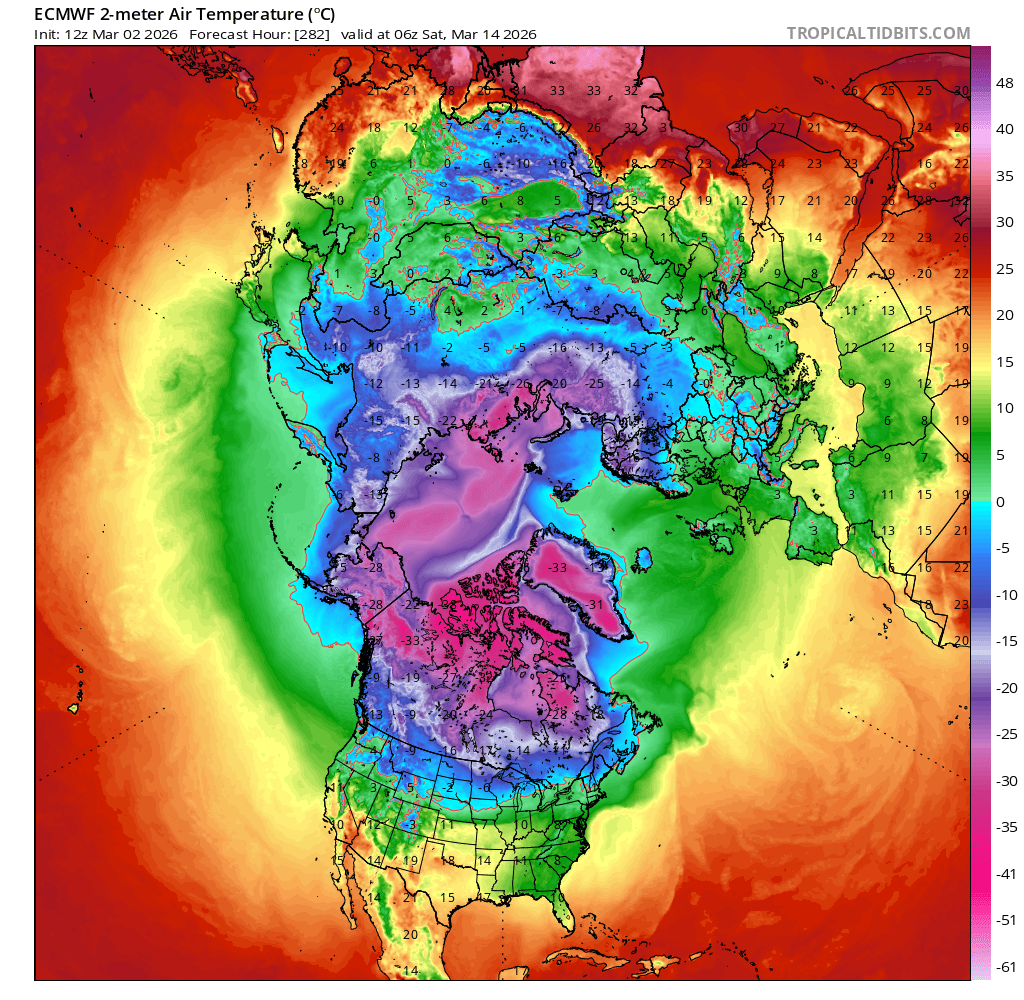
The omega block that has brought above freezing air temps to the Bering Sea should resolve soon after which from the last few ECM det. runs show there won't be further chances to disrupt ice build up in that region until the second week of March. Regardless of how many lows develop in the Pacific it won't mattter if the conditions don't favor them entering the Bering sea under the forecast synoptic setup. The 12Z run yesterday showed them entering whereas today the 00Z run showed them not entering (less meridional flow)
Still depends on how this potential split plays out to a large degree...
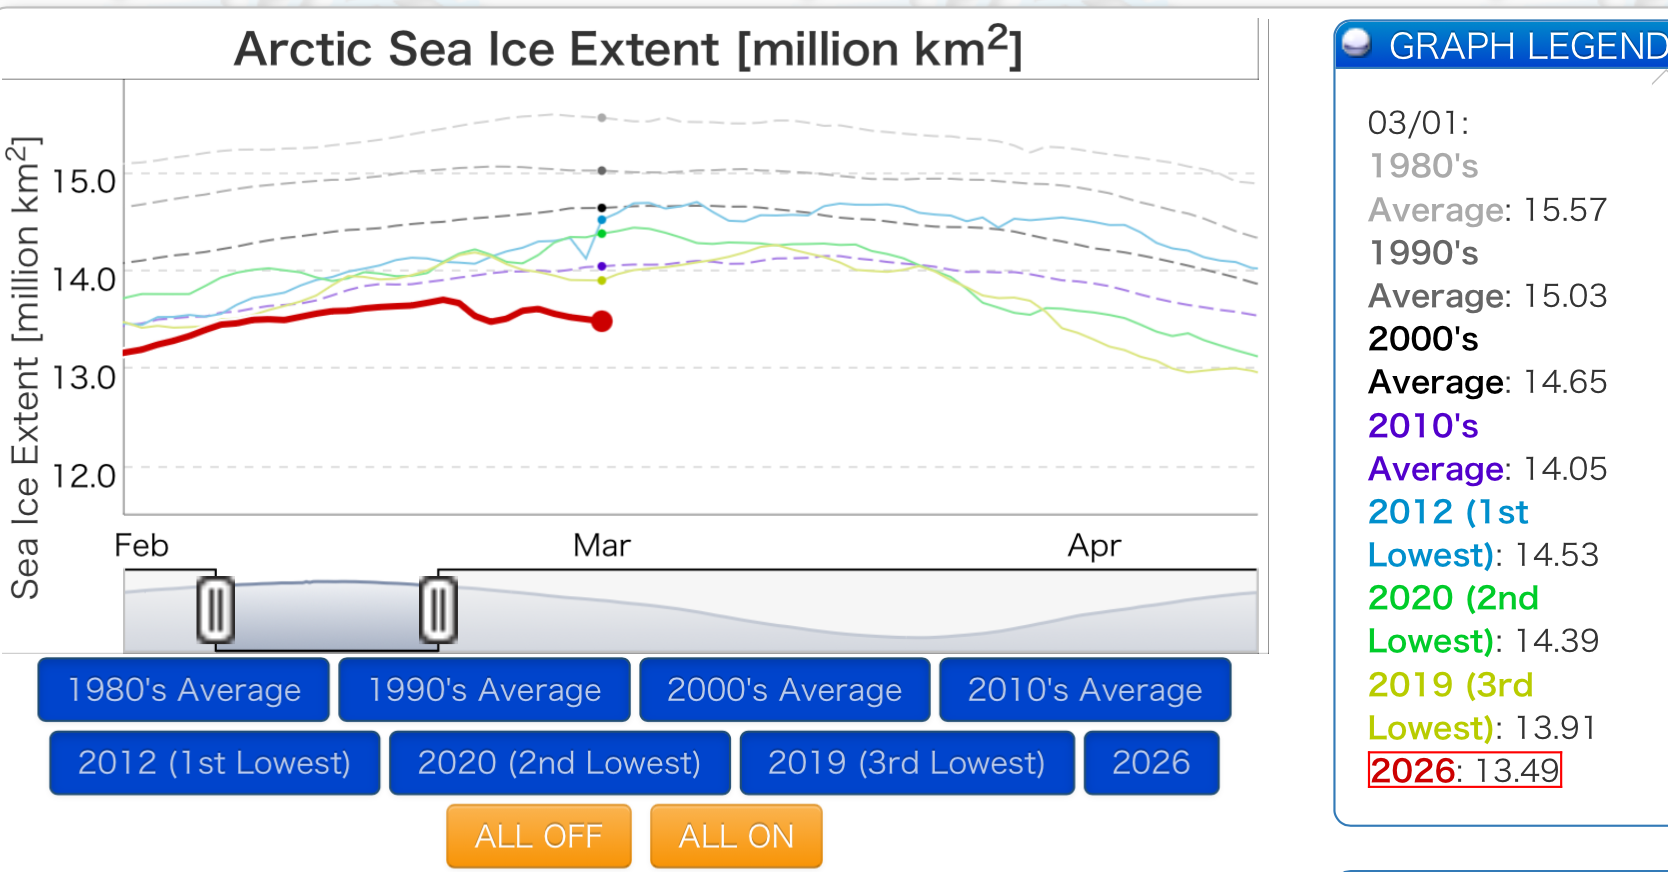
ViSHOP sea ice is 13.49 for March 1, same value as a week ago…
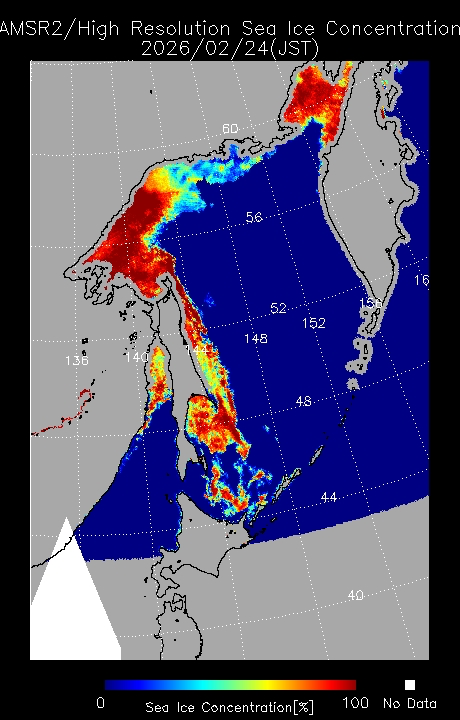
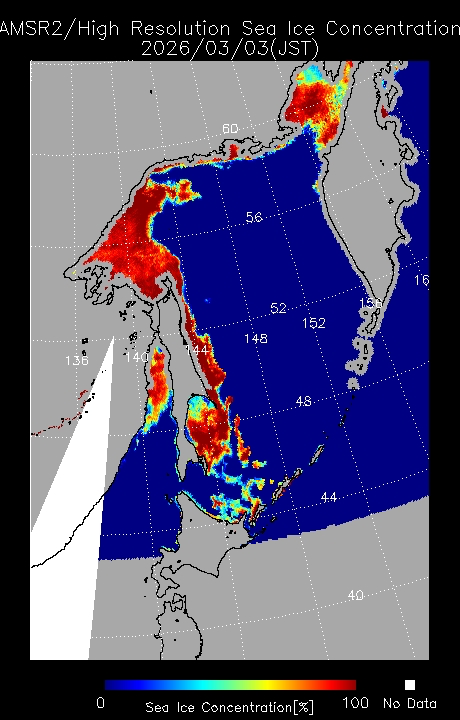
Sea of Okhotsk “lost” sea ice appears to have been compacted/become more dense under wave action and/or marginal air temps.. after a brief low developed
Another one is forecast to cross into the sea in about 5 days which should hamper any local build up again there similarly…
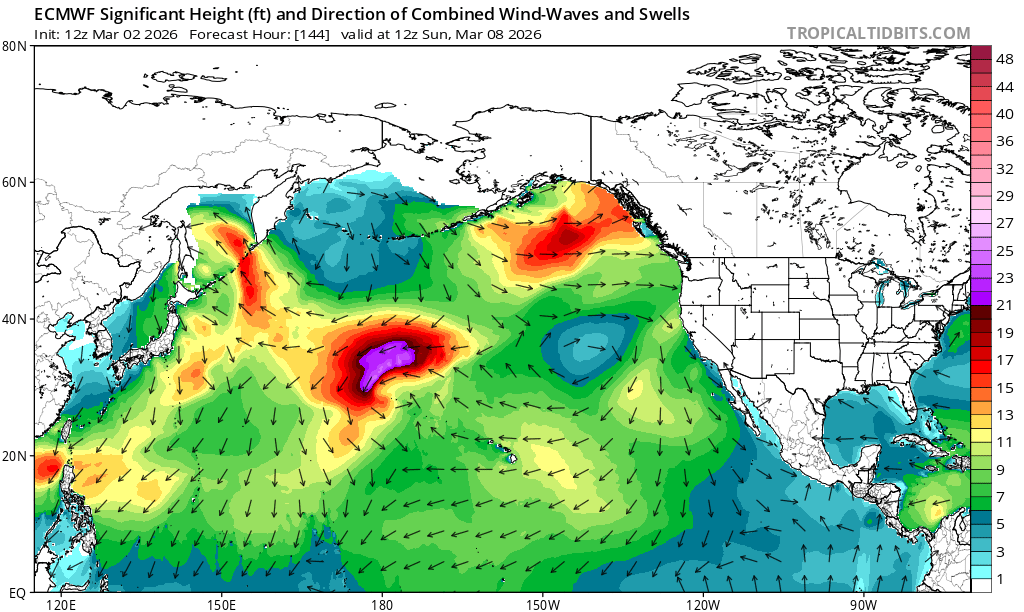
While in week 2 we will see potentially some of the sea ice in the Bering sea get compacted a bit and fail to develop further, when it appears the same low should drive unfavorable waves in conjunction with a high developing and bring above freezing temps for the areas needing more sea ice..
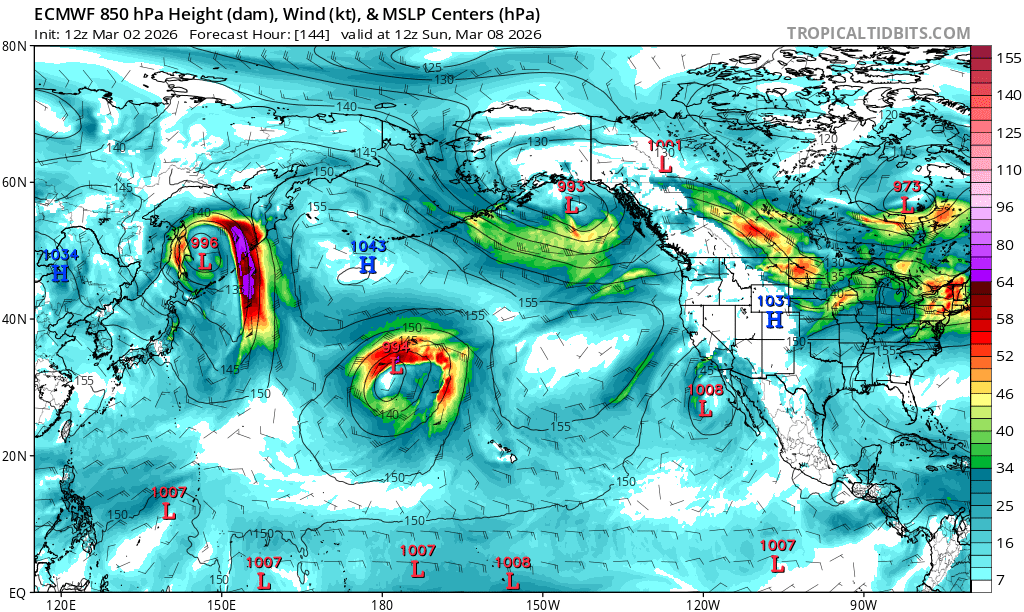
As for the Labrador Sea and Barents Sea ECMWF deterministic doesn’t show the same picture as the more averaged out ensemble (contours not in agreement like there was over the Pacific) is harder to decipher, but based on the det run it looks less favorable for development going into week 3 locally in those areas based on air temps.
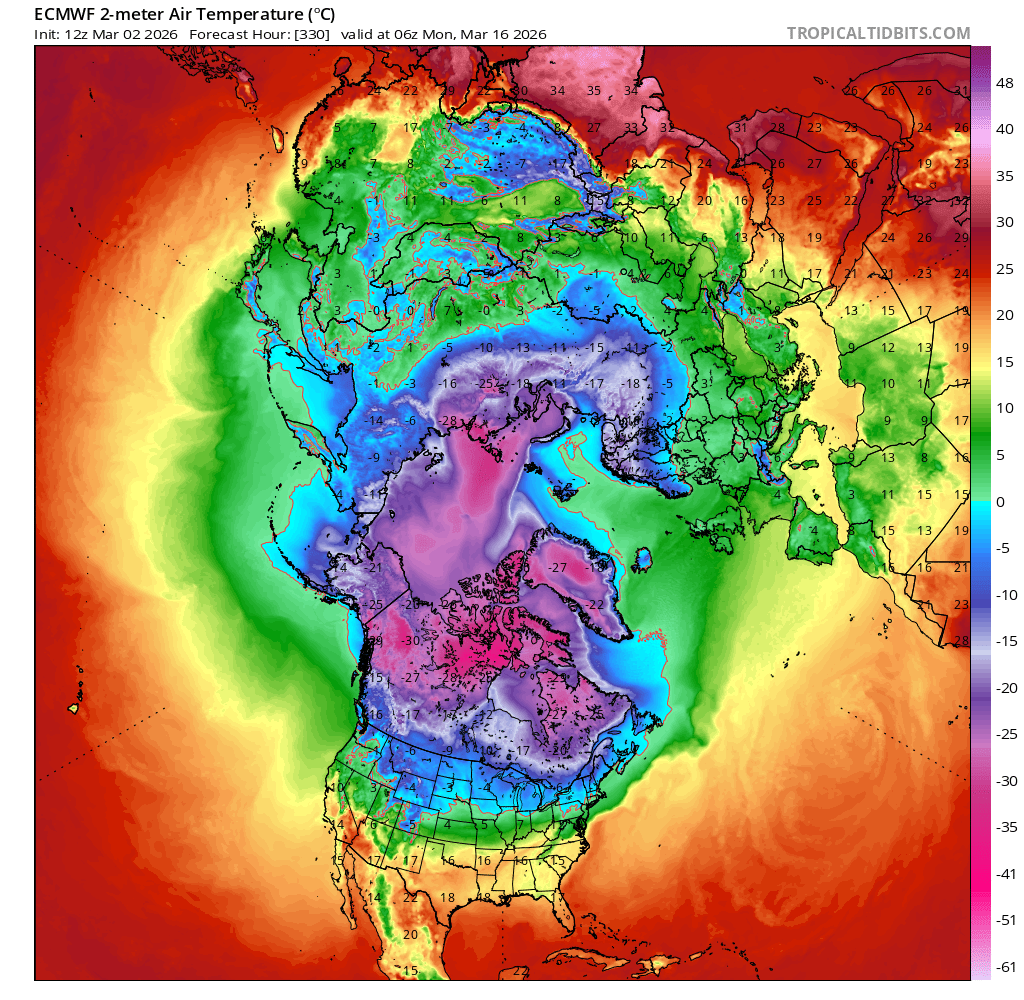
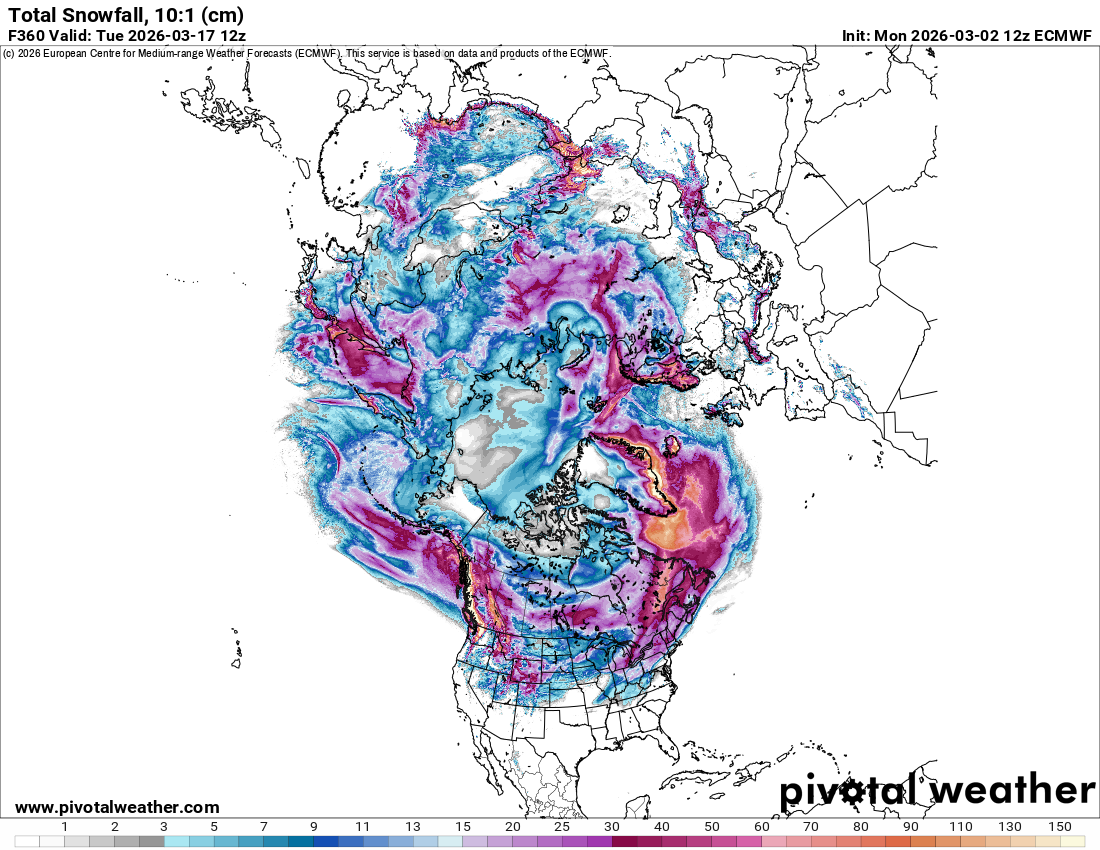
Snowfall in week 2 looks also to inhibit further sea ice buildup in the Labrador Sea (assuming that the PV splits and the lows near there develop so, so this is a bit lower confidence).
~
The buildup in the Bering sea and Labrador Sea over the last week or so has countered some of these recent losses, so I do expect some slow buildup all other things being equal as they have been, at least until week 3, or so I speculate.
Based on this outlook for the next two weeks, I don’t expect a rapid jump like we’ve seen in some of the last 15 years. After that we can only speculate based on climatology and low skill CFS forecasts (especially since this will follow a PV split)…
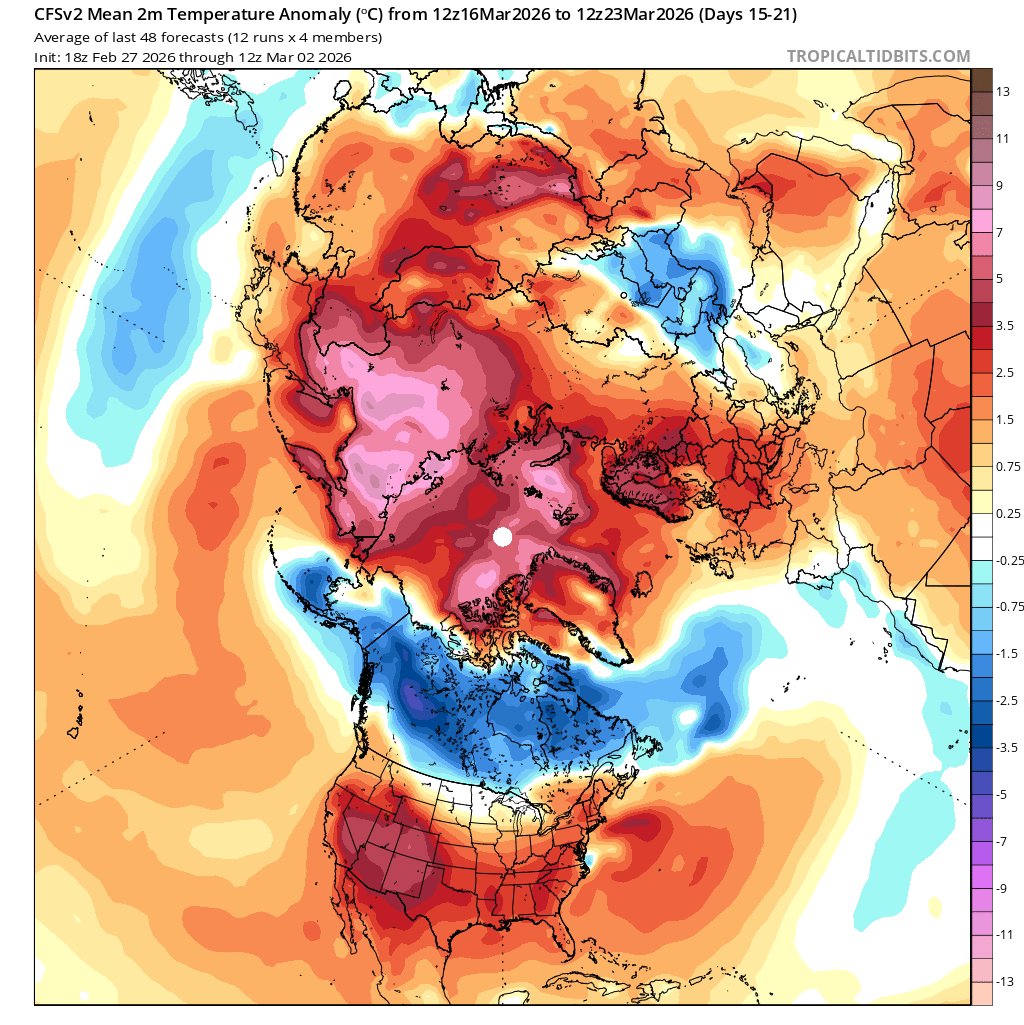
it’s hard to tell but CFS does show less anomalous heat for the latter half of the month (this could just as well be an artifact of averaging/timing), so I would expect it to generally follow the climatology and generally plateau and decline towards the end.
~
That leaves me with the subjective impression of the forecast 5 days ago of being perhaps either around right or even a bit high, if we end up with a mean below 13.6, as that is looking slightly more likely at the moment then above it. I’m not sure I would bet so heavily on the 13.2-13.4 bin being more likely than the 13.6-13.8 bin as it currently stands..
~
On what I’m sure is a completely unrelated topic, a cool video of a bird walking on top of waves of sea ice:
https://x.com/equine__dentist/status/2028576223413112860?s=20
@parhizj Thanks for the analysis.
Not sure I agree with your bolded conclusion though. (possibly badly calibrated?)
Taking first two days of March plus movements thereafter for years 2008 to 2025 I get
under 13.2 1 and it is only just under
13.2-13.4 6
13.4-13.6 8
13.6-13.8 3
You seem to be suggesting we are more likely to get plateau than aggressive growth so that implies less chance of 13.6 to 13.8 than 3/18 = 16.7%
I have reduced 13.6 to 13.8 from 21% to 18%.
I also moved more in favour of 13.4-13.6 rather than 13.2 to 13.4 but that could be wrong and I perhaps should pay more attention to your forecasts of limited growth and treat 13.2 to 13.4 as the most likely bin in spite of my numbers above suggesting 13.4 to 13.6 as the most probable bin.
@ChristopherRandles I would be somewhat surprised if we end up in the 13.2-13.4 bin, but this seems to be quite to depend on what is your reference case is for the first half and second half of the month.
(Subjectively, I think 2025 or even less than 2025 as far as day-over-day changes is a fairly reasonable proxy for the first half of the month).
For instance, considering an ad-hoc method of using the day over day deltas, if we end up with 1/3, 1/2, or even 3/4 the change (i.e. 1/3 * day over day deltas starting from March 2nd value), through the first 15 days of March and normal deltas afterwards (based on the subjective outlook I provided), then it depends greatly on what you use for your reference period since the March trendline changes greatly based upon on it:
a) If I use 2025 as a single case (my favored proxy): I get a mean for March of 13.52, 13.56, 13.63 respectively (where it generally rises fairly decently for the first half, then drops substantially.
b) Using a 2000-2025 average for each day over day delta, I get now a downward trend for most of the month (with most of the decrease in the first half actually), with a mean of 13.36, 13.32, 13.26 respectively. Subjectively I don't find this plausible based on my outlook (I expect some very modest sea ice uptick in the next 10 days, but not a plateau or negative), but on the other hand taking only the recent day-over-trend this seems very plausible.
c) If you use the entire dataset: you get a modest increase in the first half of the month, and a much milder decrease in the latter half, with a mean of 13.45, 13.46, 13.48.
If you don't discount b) for the first half of March (which I do) then I think its probably a good idea then looking at all these scenarios to favor the lower 13.2 - 13.4 bin more then the 13.6-13.8 bin.
Haven't looked at the models but glanced at polymarket which covers the other nsidc and the daily max:
Unfortunately the market looks illiquid and the probabilities don't add up to 100% but the most crowded bin is 14.2-14.4, with yesterday's NSIDC value of 14.113, so they are anticipating some modest growth also as far as the daily max.
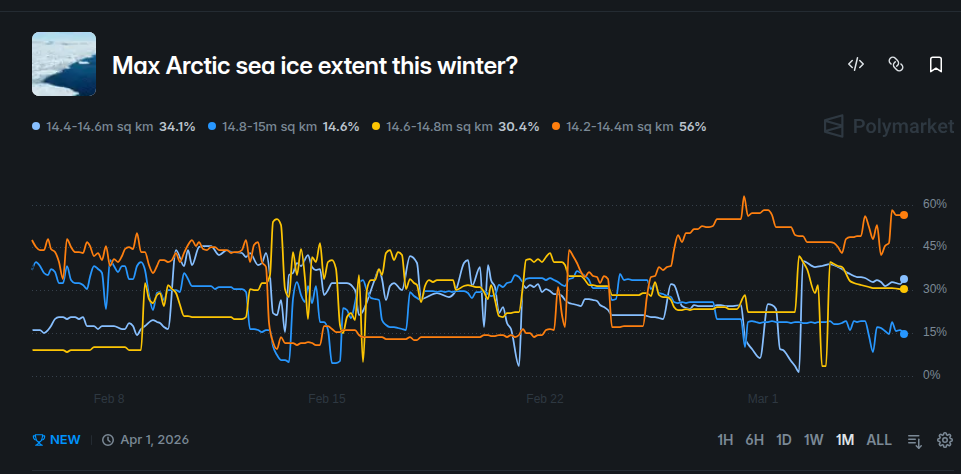
If you take the bin mid-point of 14.3 as the expected value of the market, for reference, this is slightly less than half of the explosive 2025 growth for March: ((14.3 - 14.113) / (14.307-13.908) = a factor of 0.47 (which would put it in the middle one of the above three scenarios for 2025 (a month mean of 13.56)).
You can also try to in an ad-hoc way to interpolate using the change (using the latest ViSHOP value) until Mar 15th at this rate of growth (with a scaling step between the datasets fixed by the Mar 4 ratio):
((((14.3 - 14.113) / (14.307-13.908))) * (14.197 - 13.908)) * (13.59/14.113) + 13.59 ~= implies a daily value of 13.72 in ViSHOP dataset by March 15, after which you can follow whatever reference you like (2025 had a few days of further growth which seemed not impossible) but I expect it should generally decline on average, and usually slightly faster than it rose and ending up deeper than the month start (so still below a 13.6 mean).
@parhizj >"a) If I use 2025 as a single case (my favored proxy)"
"b) Using a 2000-2025"
These seems a little strange to me. I see 2025 as an extreme low outlier perhaps (most particularly so early to mid Feb). The consequence of this is that the year is likely to have a late peak. We are trending towards slightly later peaks but it is not a huge effect with one year, I think the ice level and amount below trend is likely to be a more significant driver of a late peak.
So while we may be trending to more of a 2025 pattern, I don't think 2026 will be as extreme as that (though I don't discount noise making it more extreme). So 2025 as favoured proxy seems to me to be suggesting too high a level and a single case isn't good for calculating probabilities. 2000-2025 seems to be using data that is too old too much and tends to favour lower values as the peak tends to be earlier in those early years and the ice pack and thicknesses are quite different.
Using an average of years gives you an average result and you don't see the noise that can give different results.
Using 1/3 or .5 or .75 of daily moves means you are reducing decreases and making large decreases seem unlikely? This seems like it is improperly reducing the noise? Maybe you need to half increases and use 150% of decreases?
I am using 2008-2025 each as an individual set of movements and am thinking maybe I ought to down-weight the earlier years in this period. Without doing that after 13.59 on 4th I then I get 4 of 18 years in the 13.2 to 13.4 range and if you are expecting low increases (or larger decreases) compared to typical in the next 11 or12 days that should make that range more likely? I get 11 years in the 13.4 to 13.6 and 3 years in 13.6 to 13.8
@ChristopherRandles I don’t think there is any thing wrong with what you are doing - i just am more admitttedly ad-hoc since I want to try to put as much of my intuition as possible into it. As far as down weighting earlier years that you are thinking about I don’t have an opinion which reference case is best, but I’d like to do an experiment once where we find which years are “recovery years” following a lot of melt and adding them to see if that distribution for March day over day changes is noticeably different from other arbitrary reference periods. In summary I have no disagreements with the basis for your current calculations.
This is all just best guesses since the synoptic situation is still highly variable in determining whether we get a modest drop or a large drop in the last 10-15 days or so, but yes I agree with the next 10 days in anticipating we won’t see an extreme 2025 rise, after that I am bearish on predicting confidently how much it will drop on average day over day for the remainder of the month, not only referencing the dynamic models but any statistical analysis.
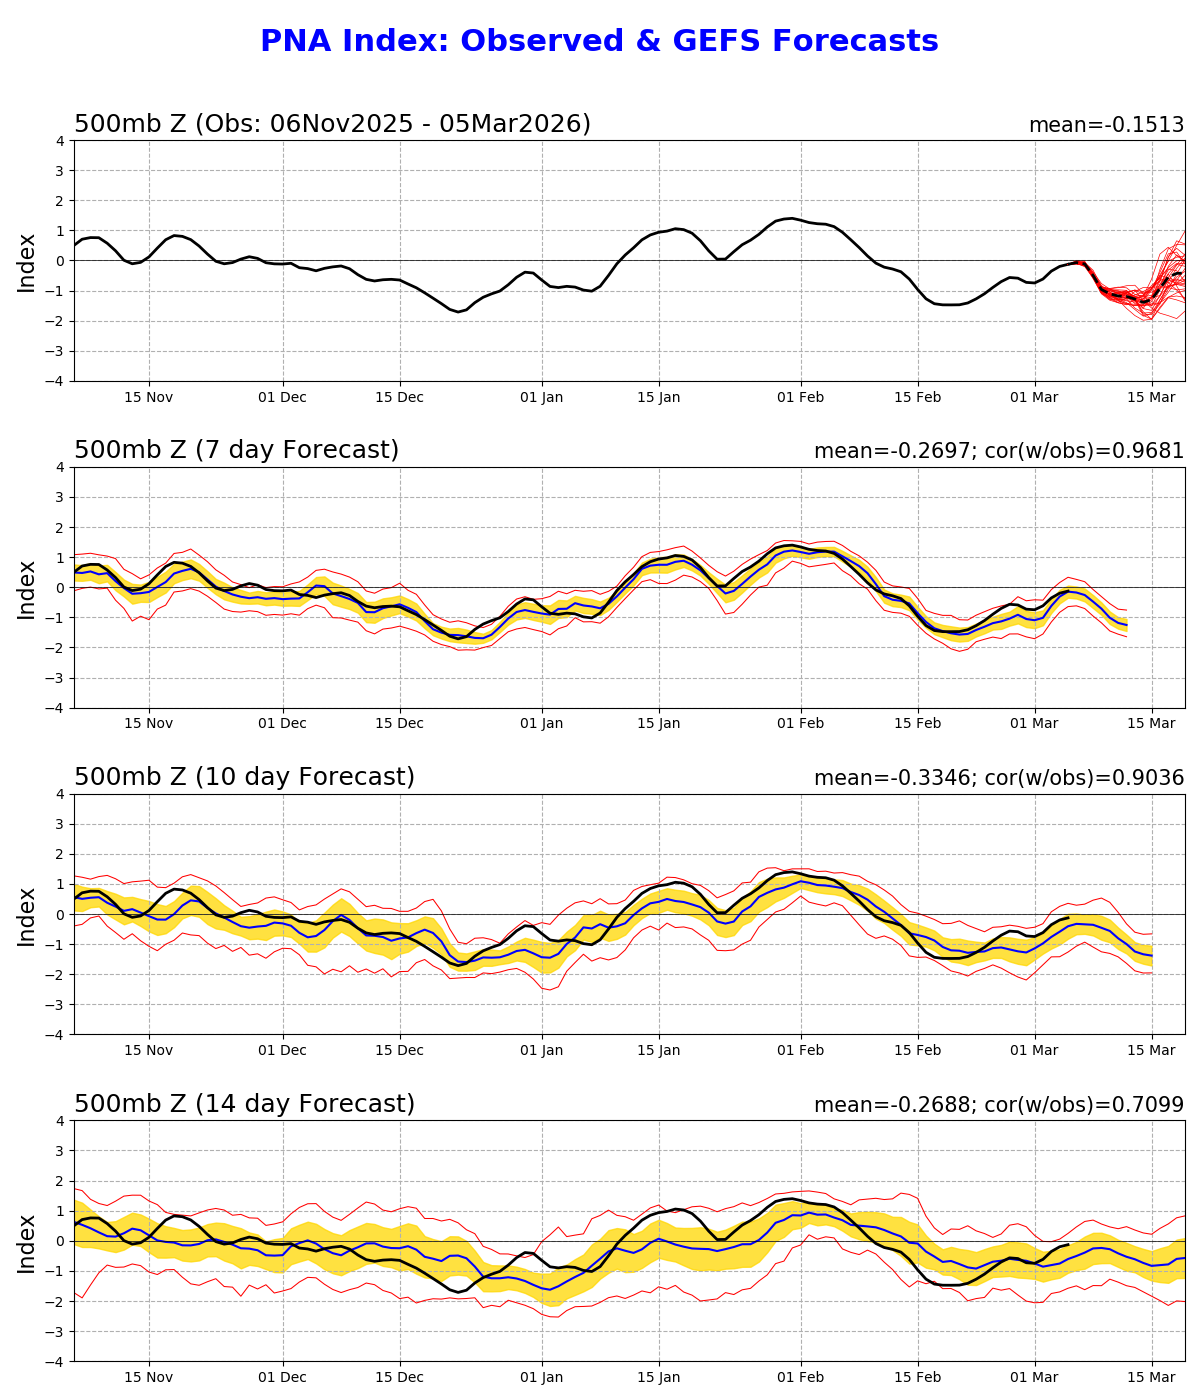
I.e. the PNA is trending more neutral in 15 days but I wouldn’t bet a dollar on whether it’s going to end up neutral positive or negative then despite the high historic correlation, given the effects from the PV split will have started to propagate by then. And this even then will only partly determine whether we see more or less buildup in the Bering or Okhotsk sea, since we might have more wave action from lows passing by, or another blocking high persistently develop over the Bering sea.
Again, I’m going more along the line of thought that the processes and states (patchy, new ice) in 2025 are more comparable to 2026 than a previous decade, with freeze up rate being less favorable in 2026 than 2025 for reasons stated and less stable sea ice (more to lose in the Bering Sea). I don’t think there is any problem with using the factor on the day over day changes for three scenarios mentioned since I am aware of what the trend is for the first half for each scenario, and since what matters is the mean over the 15 day period and the simulated value on the 15th (after which I follow the regular day over day changes).
For reasons mentioned it’s hard to pick a good subset range for statistics that matches when you think it might rise and fall and by how much, but this is sort of beside my point for the second half of the data as I was only going out on a limb for the first half of March based on that outlook. For the second half of March I mostly just stuck to the regular day over day changes there afterward for each reference subset. I only explained by I disfavored (b) based on the first half of the month’s outlook, since that was a generally bearish trend that disagreed with my modestly bullish outlook.
For your point about 2025 being a singular case being too noisy or not a good proxy I understand your perspective, I just have a difference of opinion with respect to what is proper or not for the best reference, as I think though since we are going to likely end up with the second lowest or lowest maximum on record along with last year also being being so low, that taking the last year as a reference is still ok (if sketchy) at this point considering if we still have a lot of melt left over from summer, and is perhaps more appropriate than just any arbitrary window of a previous decade or two which will be far from representative from the lack of multi year ice and hotter climate. I’m not sure which is sketchier to be honest.
@parhizj You were quite right to warn me against 13.2-13.4, ice has bounced back up to a new maximum so far of 13.76 for 7th and 13.2-13.4 is looking very unlikely now.
Looks like we quickly caught up to roughly where we were last year based on daily data.
Jan 1, 2025 was 11.91
Dec 31, 2025 was 11.88
Mar. 2025 monthly mean was 13.54 for reference, so based on that alone looks like no update is required to this market since the point prediction is 13.53...
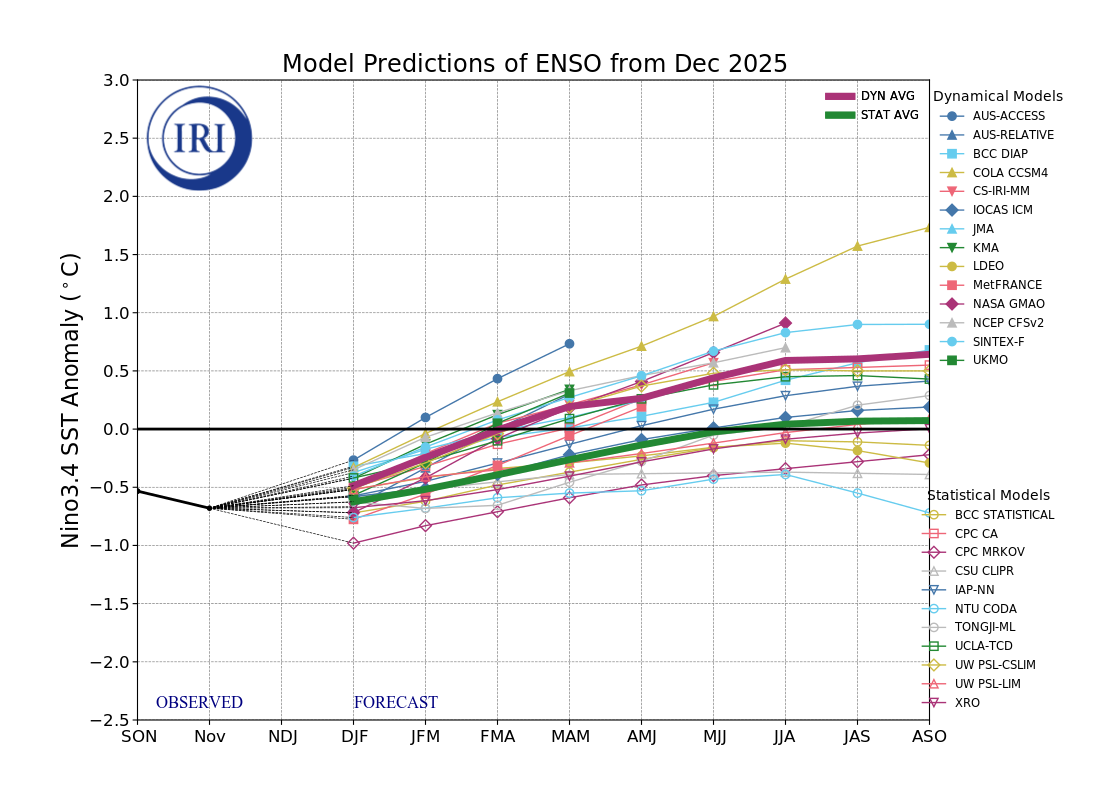
ENSO however looks like it will return to neutral by ~ February, but given that last year we were in still in an El Nino for those months, I think based on that alone we should expect greater freeze up in the coming months for 2026 compared to 2025...
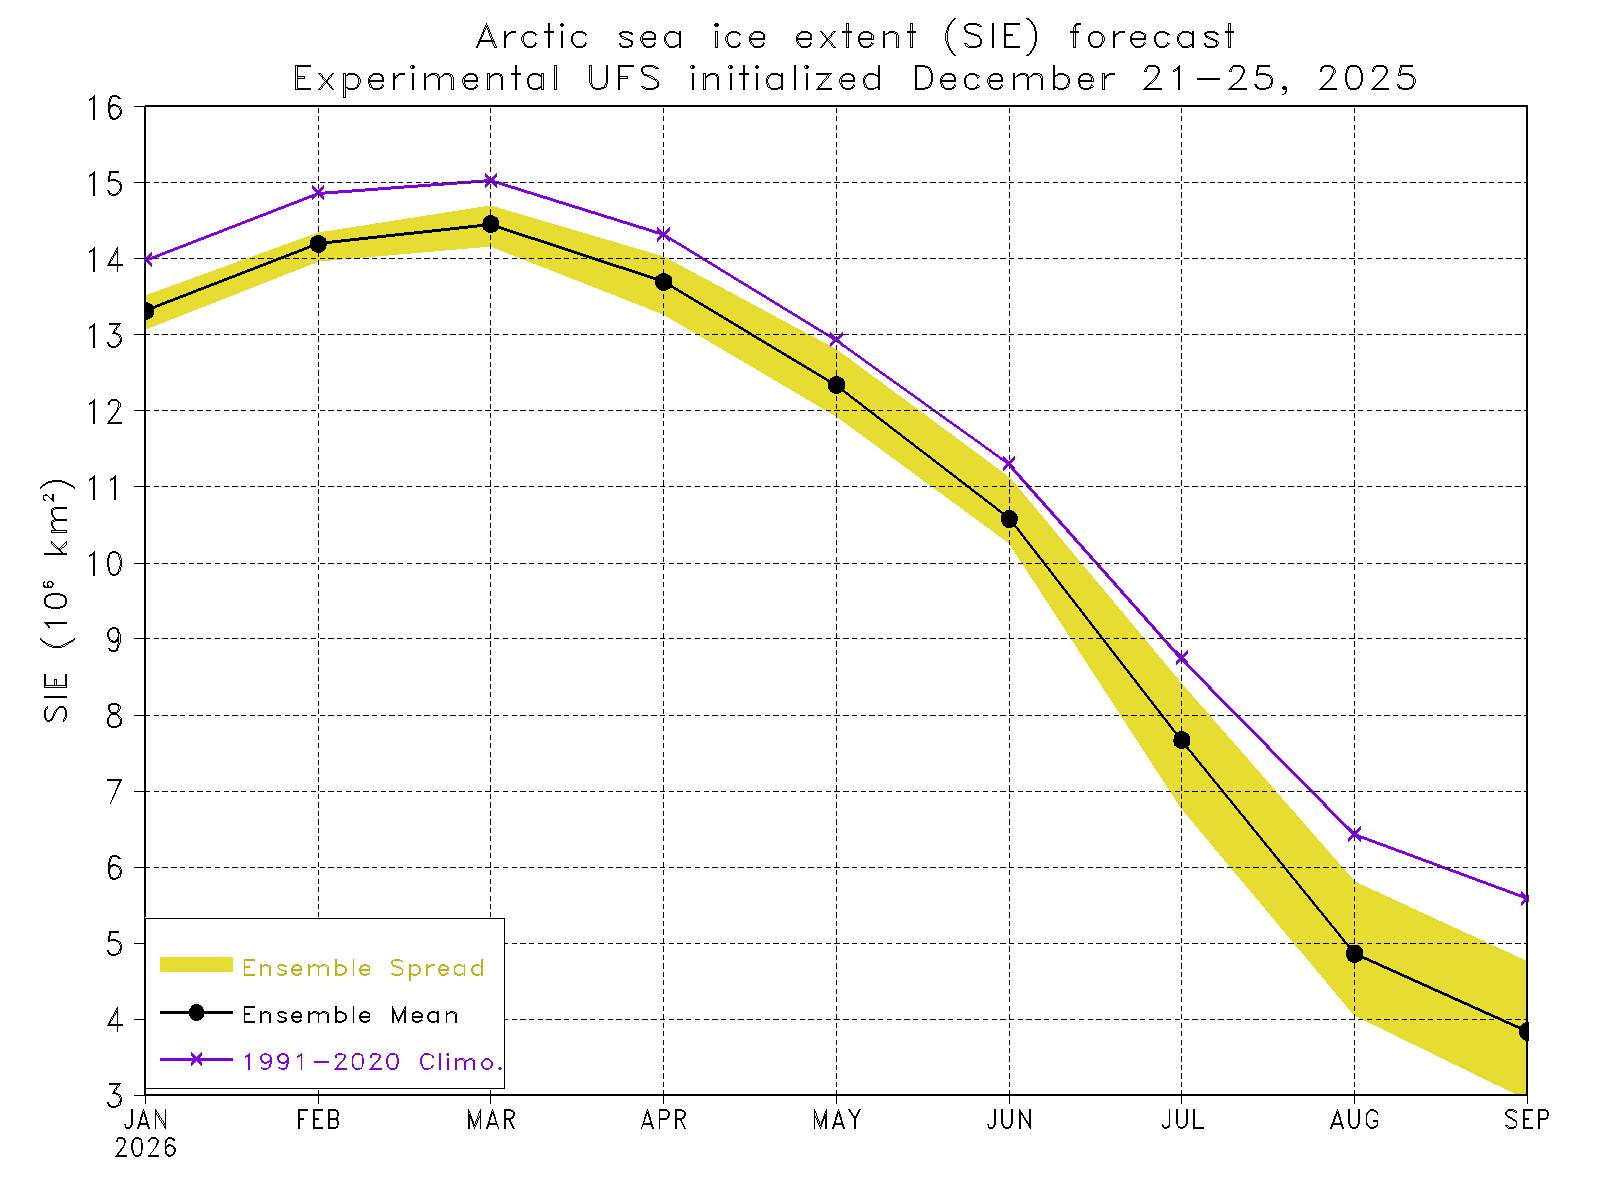
UFS is still quite a bit higher and has dropped only marginally since I last checked -- after subtracting about 0.535 or so for the difference in datasets, eyeballing it yields around 13.9 for VISHOP:
@parhizj ENSO is a long way from the Arctic. There might be some effect (hard to tell?) but if there is an effect I would suggest it may well be delayed quite a lot?
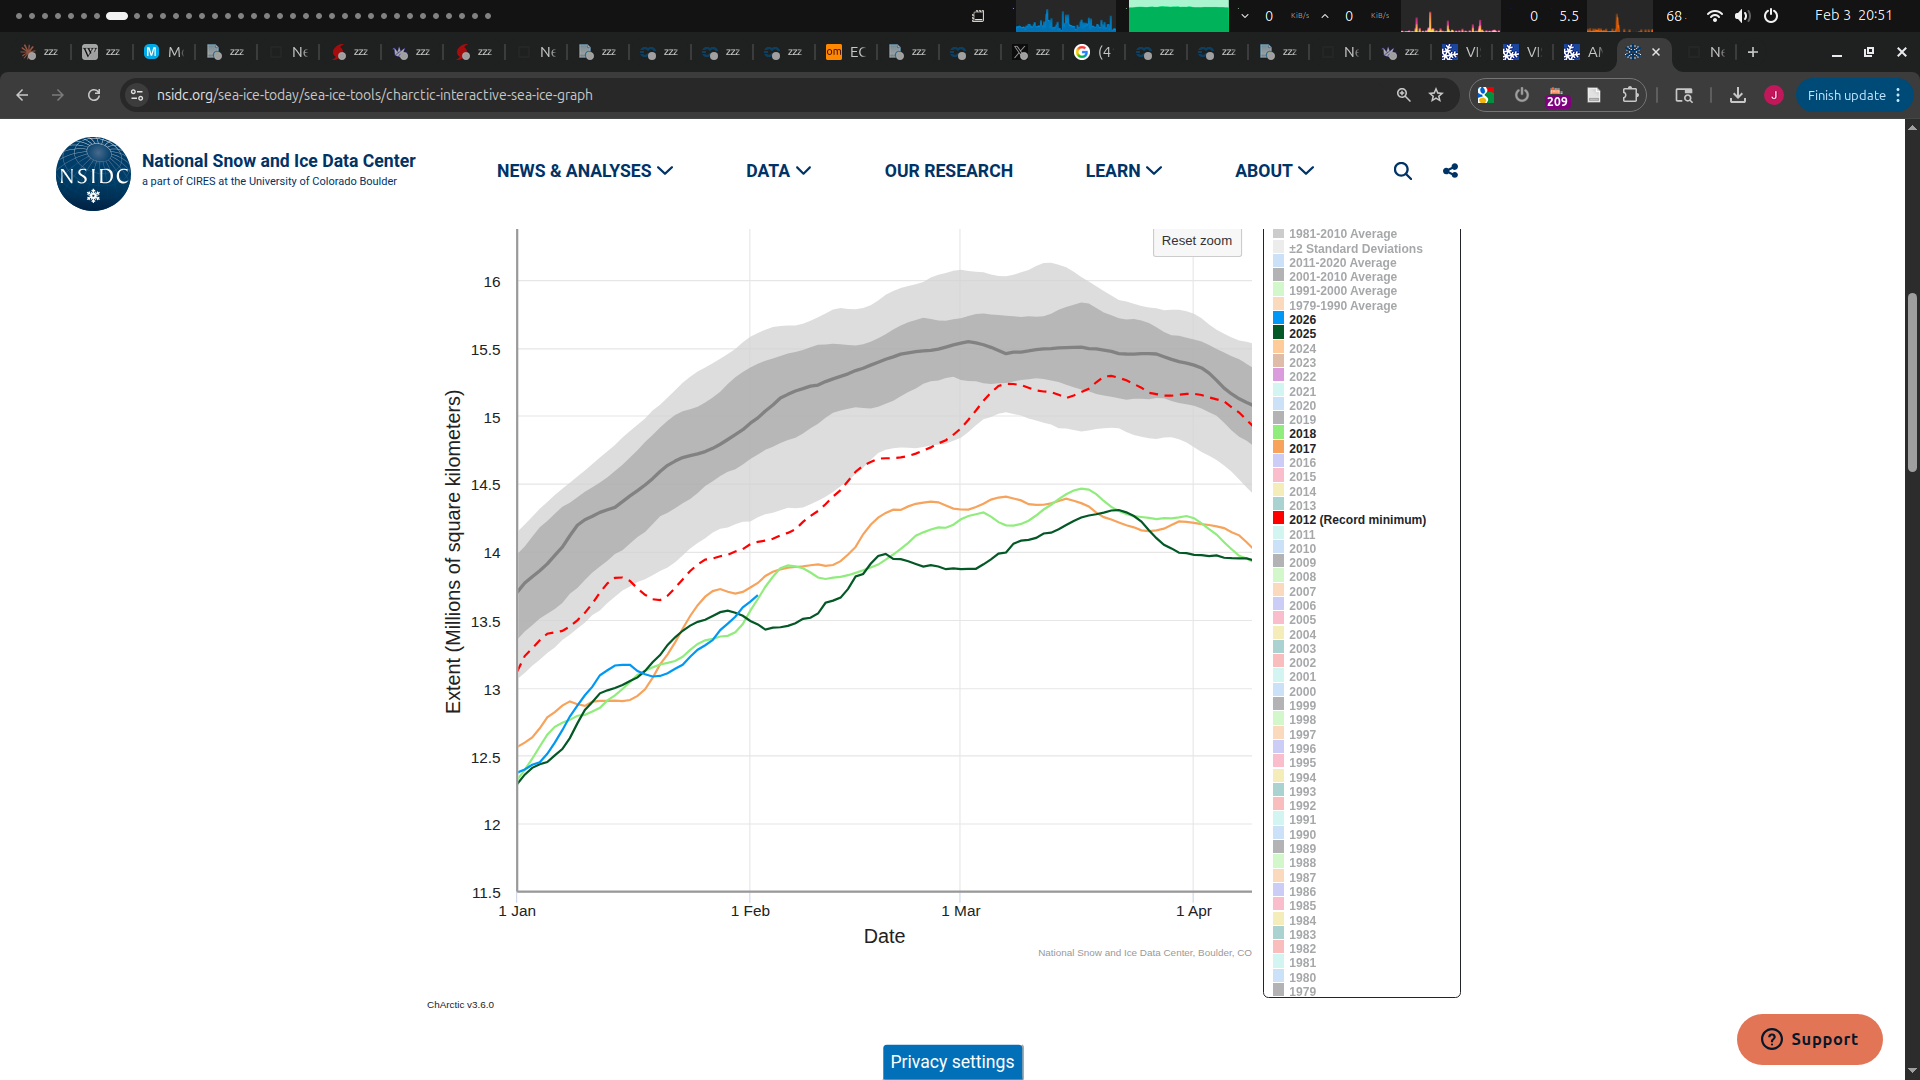
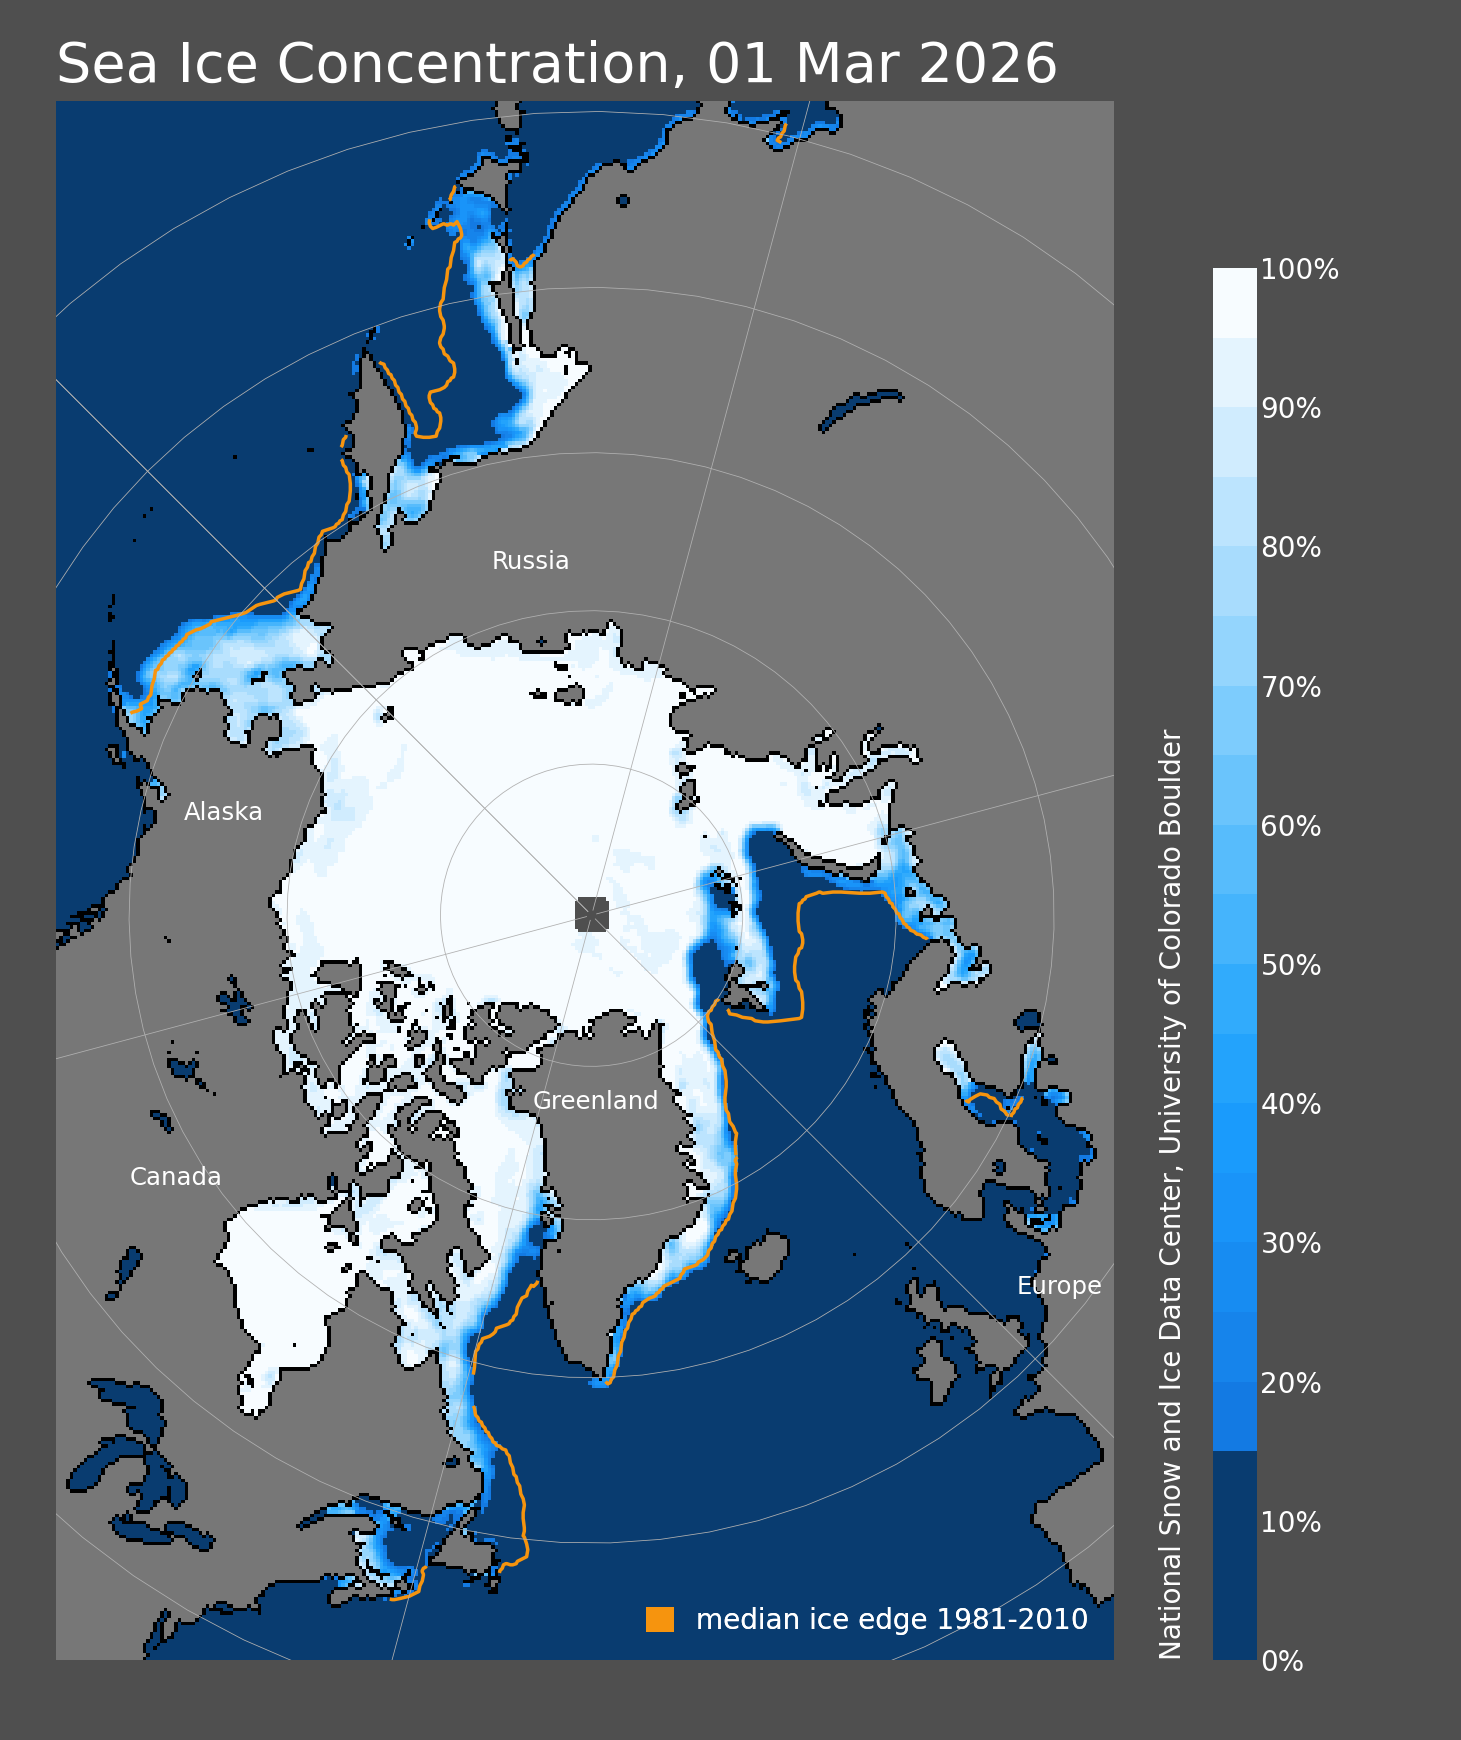
Referencing NSIDC since it has a nice easy chart we are still fairly low.
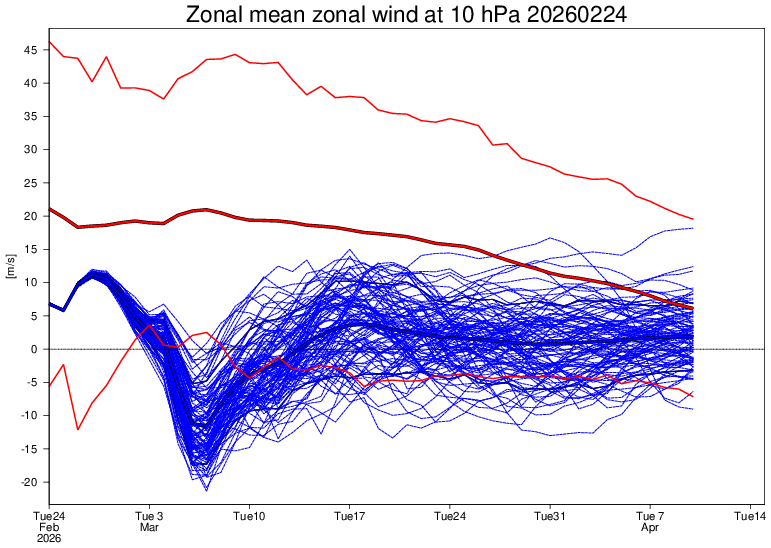
I think its still too far out to say whether we will get a polar vortex split from the medium range models, but if the rough timing from the last few runs verifies we will probably start to see a resulting plateau in the end of February .... (probably a trend similar to 2025 then but delayed a week ?). Though, there should be a bit more confidence in predicting it this time given how stretched it is already (at the very least it looks like a pair of anticyclones develop from the upper stratosphere downwards this time) ...
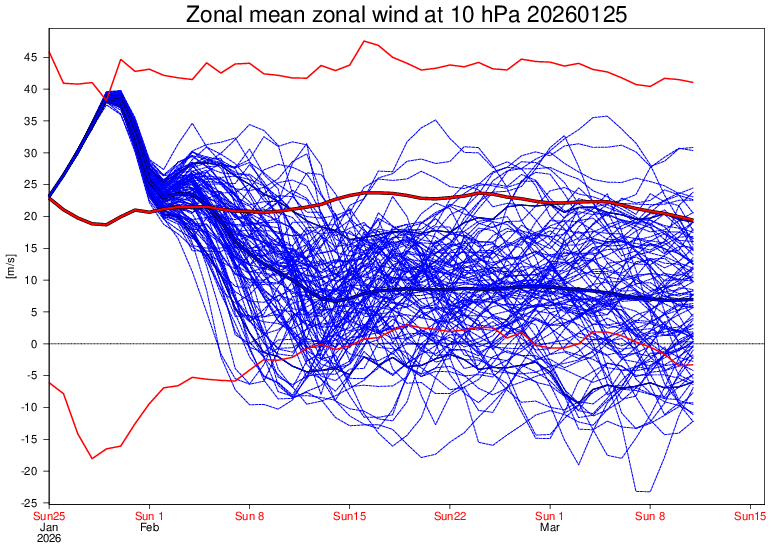
upper strat:
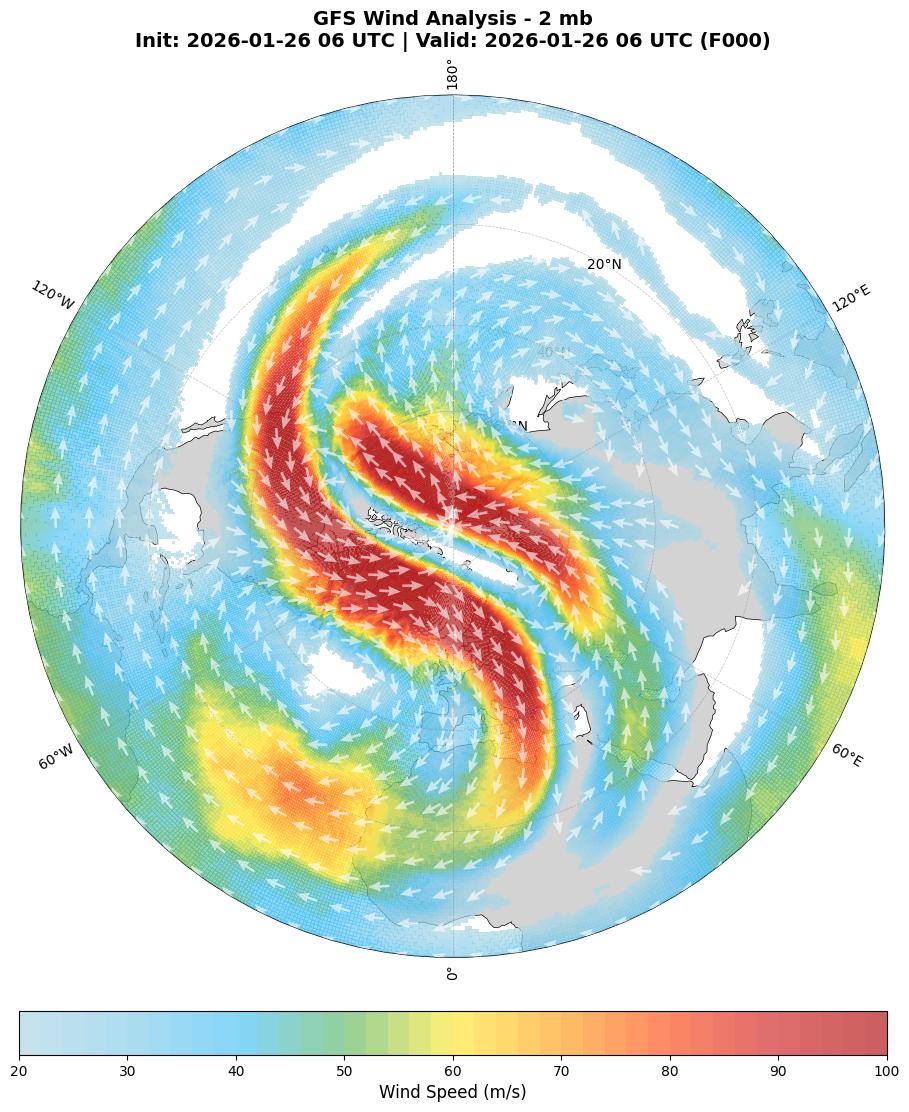
10 hPa winds from a pair of recent runs near the end of the medium range:
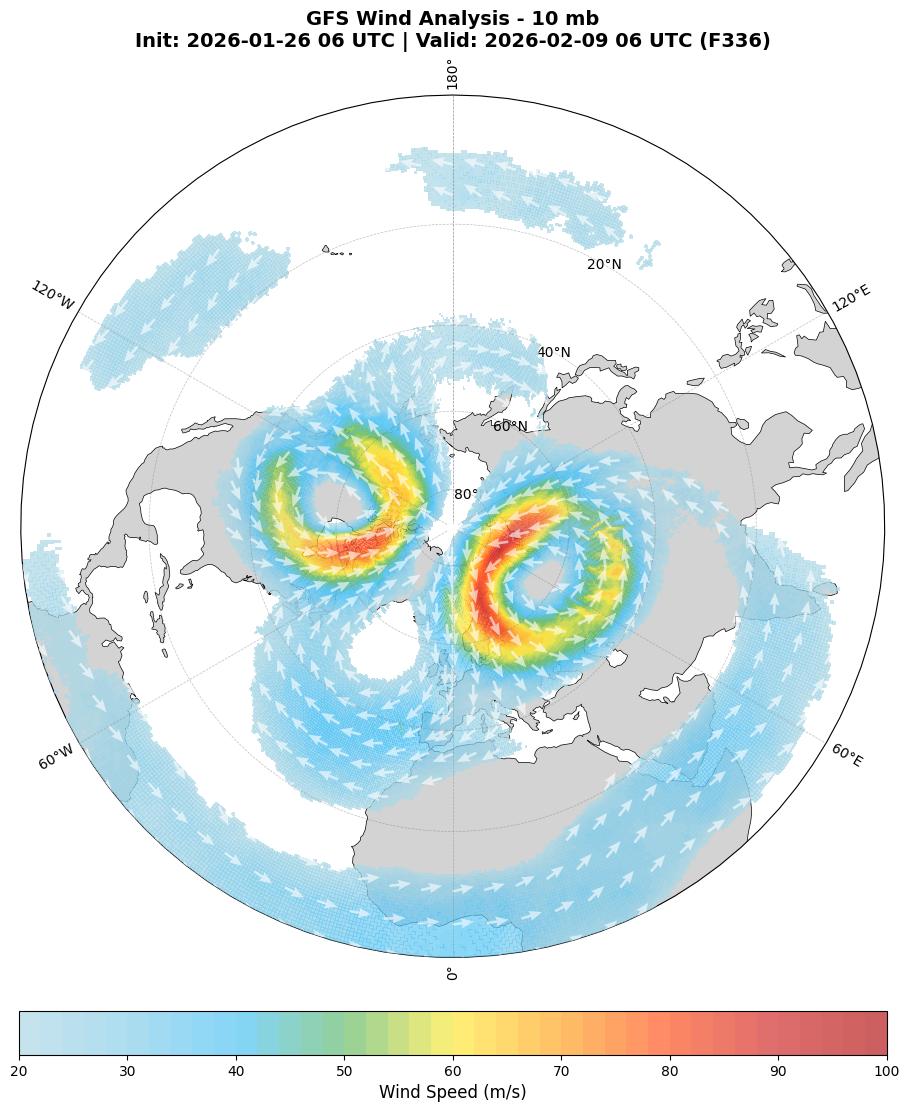
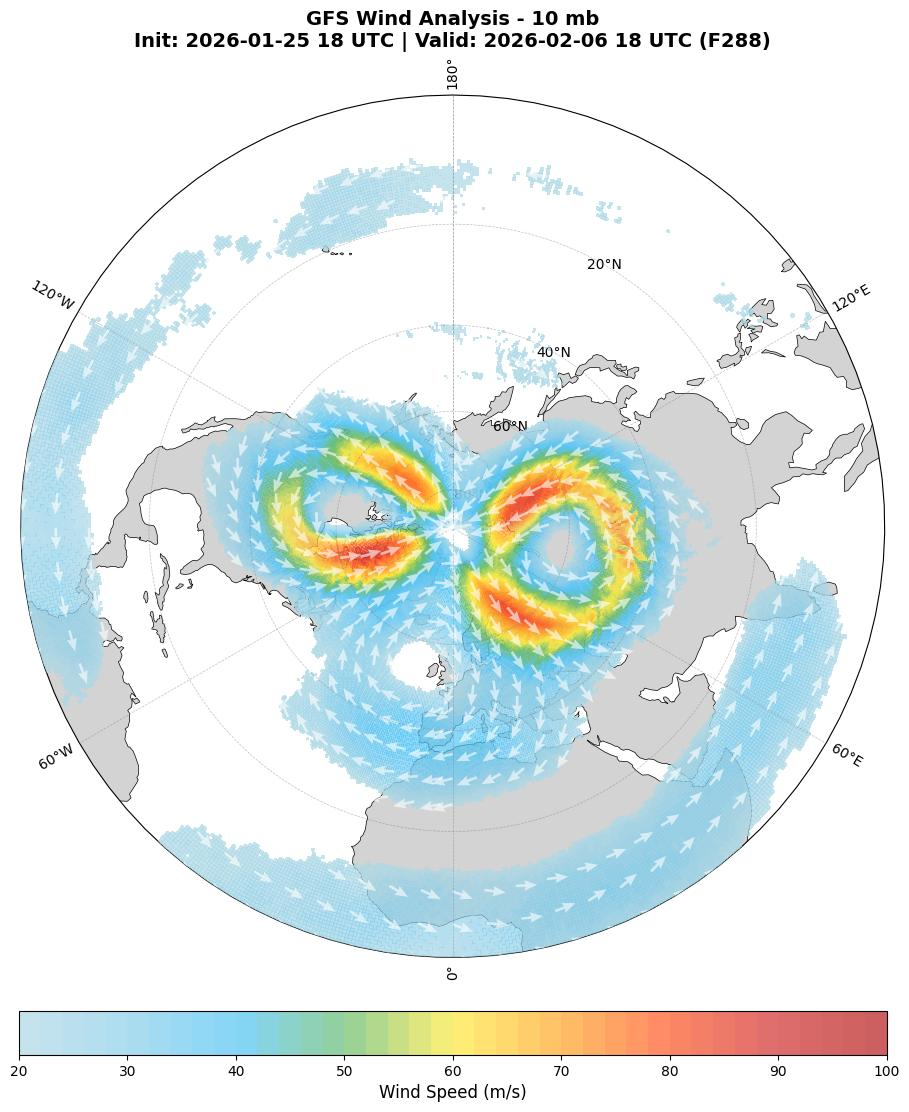
At the very least the timing of it will be a bit variable...
I noticed polymarket also now has a related market (but for NSIDC and for the daily max though) (the daily in NSIDC is technically a 5 day trailing mean). It is a different dataset, but at the moment it still seems a contender for the mean low this year even just referencing the daily max market....
https://polymarket.com/event/max-arctic-sea-ice-extent-this-winter
this prediction from a month ago held up (no split but more arctic warming)
Actually seen a plateau and a decline
@ChristopherRandles I was surprised by your initial predictions being on the high end and ended up browsing data…
I only had a vague guess that it would be on the low end based on looking at some simple statistical calculations and the recent anomalies i mentioned on the gistemp market, but looking at a similar webpage that references a different dataset, some simple statistical indicators to date would seem to indicate we might be headed towards even a record low…
https://forum.arctic-sea-ice.net/index.php/topic,4329.msg434830.html#msg43483
At the very least the area sea ice extent matched my expectations from seeing the anomalies from gistemp (https://forum.arctic-sea-ice.net/index.php/topic,4329.msg434711.html#msg434711)
I looked at CFS (https://www.cpc.ncep.noaa.gov/products/CFSv2/CFSv2seasonal.shtml and it shows more towards the high end but accounting for some cold winter bias which it is known to have and examining the last few years of Nov init SIE predictions, not the highest bin (the bias by eye between the two datasets looks to be roughly in the +0.2 to +0.3 range compared to vishop from a quick glance), which would put the mean in the third or second highest bin? This was a bit surprising also…
I glanced at the NMME products also to figure out what’s going on
Aside from some below average temps north of the east Siberian sea… (because elsewhere it still looks like quite anomalous temps)

I can only speculate that perhaps above average precipitation in Dec and March will bring it up? I don’t know 🤷


@parhizj There is strong reversion to the trend. If there is low ice extent as winter approaches then there is lots of water that gives off heat easily whereas ice insulates the warm water so much less heat loss. The ice formation depends on the amount of heat loss.
Above is pretty solidly based on thermodynamics physics and the data shows it.
What is much less clear is whether after a year with a strong downward movement, do you tend to get a rebound the next year? Graph probably suggests no (1 yes 2 no?) and I may have overdone my expectation for a relatively high level this year.
An upward trend since 2015 I would suspect is spurious. On the other hand, there was a period 2002-2012ish where the arctic changed to much thinner less multiyear ice on the Russian side. Once that thick and MYI was gone, the thinner remaining ice melts out each year, and new slower trends have been apparent since then. So a latest trend line might plausibly be only getting down to about 13.9 rather than the ~13.7 if I used a straight line through March data from 2008.

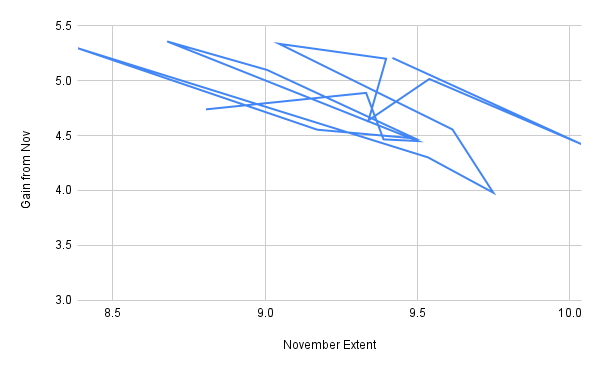
The data for above graphs
Year, March, Prev Nov, Gain from Nov
2008-03-01 14.62376506 9.418130429 5.205634636
2009-03-01 14.45991381 10.0384542 4.421459606
2010-03-01 14.55340665 9.539251367 5.014155278
2011-03-01 13.97838974 9.339794233 4.638595509
2012-03-01 14.59582716 9.3974318 5.198395361
2013-03-01 14.38029497 9.046578 5.333716968
2014-03-01 14.17024394 9.615223233 4.555020702
2015-03-01 13.72900245 9.7491209 3.979881552
2016-03-01 13.83592787 9.5349185 4.301009371
2017-03-01 13.67942894 8.384798967 5.294629969
2018-03-01 13.72431094 9.1714044 4.552906535
2019-03-01 13.96533181 9.492540759 4.472791048
2020-03-01 14.10312587 9.006902233 5.096223638
2021-03-01 14.03425487 8.678768433 5.355486438
2022-03-01 13.95167955 9.5020577 4.449621848
2023-03-01 13.85361284 9.388955833 4.464657005
2024-03-01 14.21931497 9.331787833 4.887527134
2025-03-01 13.54402413 8.8062687 4.737755429
@parhizj Precipitation adds snow to ice already formed increasing insulation and reducing ice formation though this is more about thickening of ice already present than ice formation. Snow or rain on water doesn't form ice, while solid ice pellets might sound the right state to be helpful for ice formation, I would suspect that mixing of the water might be more of a hindrance to ice formation in at least some conditions. Further the clouds needed to produce precipitation also insulates and reduces outgoing radiation so less ice formation.
@ChristopherRandles thanks for notes…
I skimmed the arctic-rcc (which just got designated by the wmo last year) presentation slides (that happened last week) and their outlook (with the last 9 years reference period) is very coarse but it appears they are roughly predicting the same categorically below normal sea ice for winter 2026 as 2025 albeit with lower confidence, although it appears to be based on forecasts from a bit earlier on (early October at the latest).
So given the vishop data has the March mean for the last 9 years as 13.897 (if I did that correctly) then it would seem they are predicting it should be below this.
They don’t have a statement released yet but it should come out soon given that their conference was last week. The presentation is below that has their outlook on page 115
https://arctic-rcc.org/sites/arctic-prcc/files/2025-11/ACF16_presentations_day_2.pdf#page115
~
Page 42 also has a sea ice concentration chart, and the slide notes the quasi cycles of 2-6 years and it does look like it should bounce back up, but will it be this year as part of the trend?

@parhizj
That is better forecast than trusting me, and I have reduced my holdings.
Also
https://climate.rutgers.edu/snowcover/chart_daily.php?ui_year=2024&ui_day=314&ui_set=2
and
https://climate.rutgers.edu/snowcover/chart_daily.php?ui_year=2025&ui_day=314&ui_set=2
are perhaps a bit similar probably worse particularly re Northern Europe and maybe that area is big enough to persist.
Maybe I should reverse holdings rather than just reduce them.
@ChristopherRandles plenty of time to update at least in the months to come based on other models
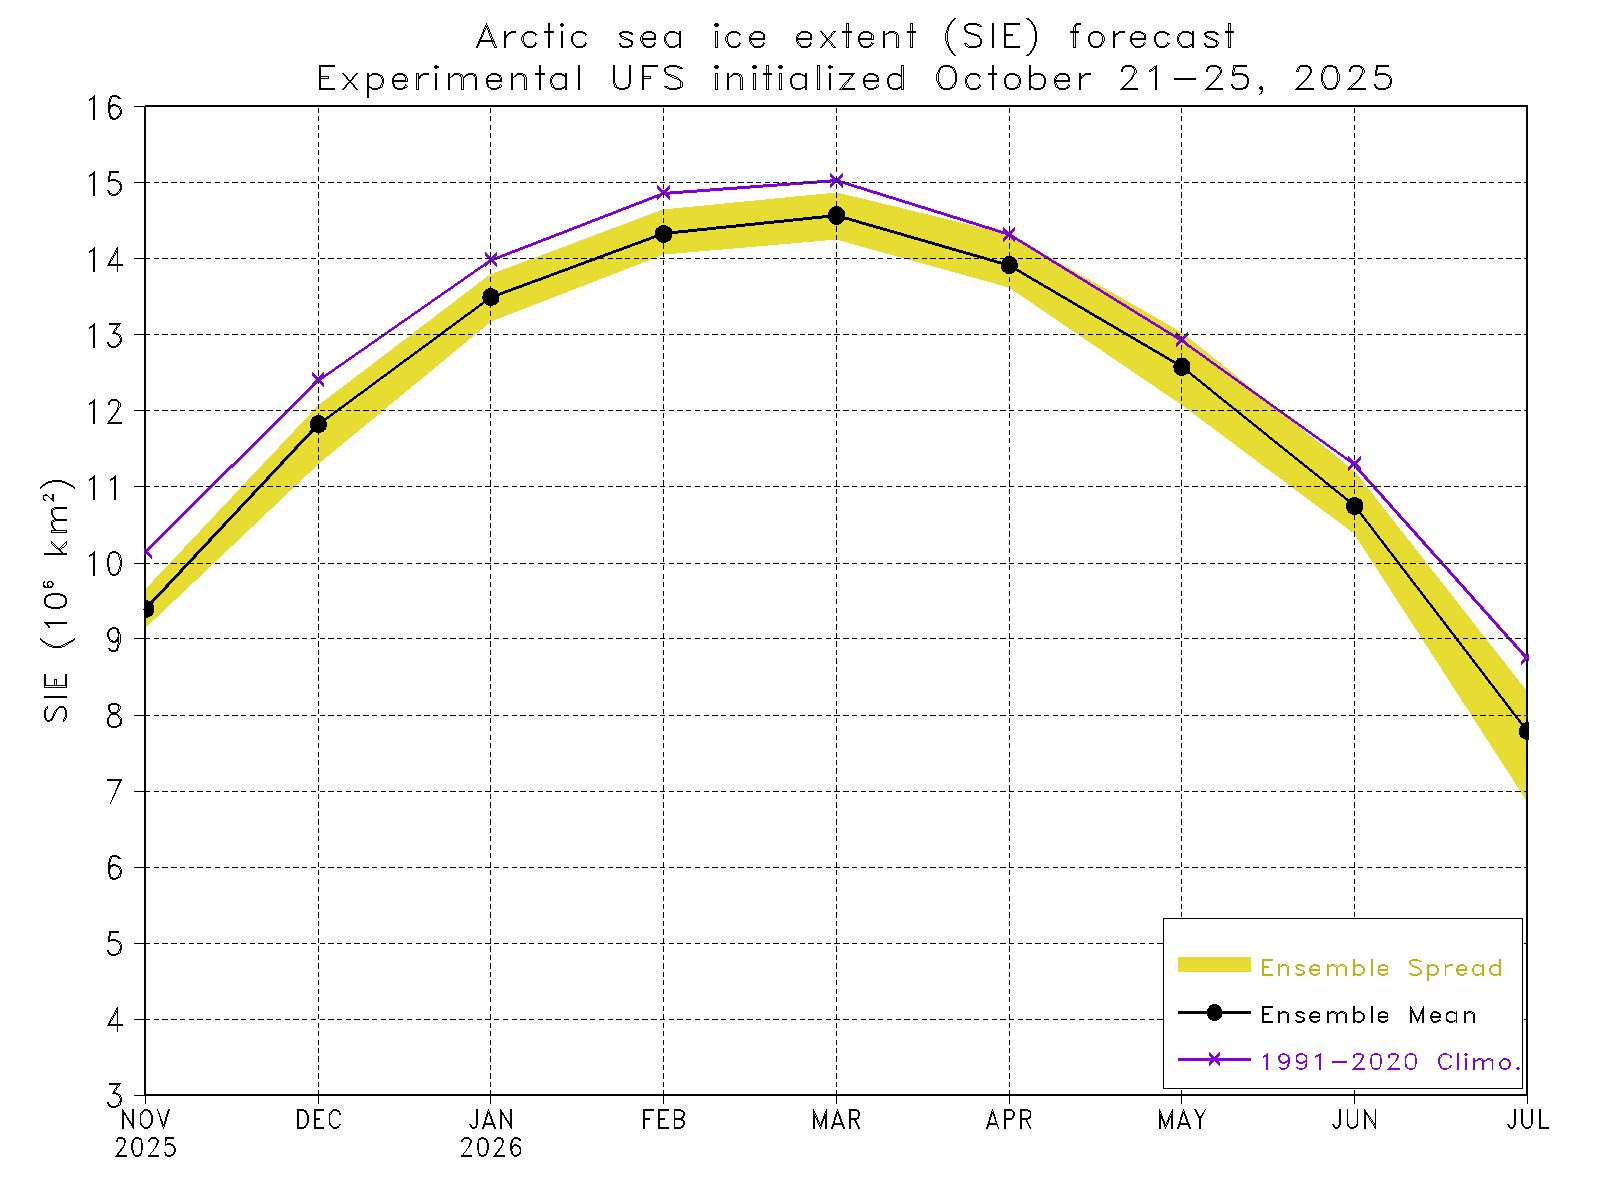
I found the experimental UFS/NOAA model I believe that the slide deck i showed you referenced below:
https://www.cpc.ncep.noaa.gov/products/people/jszhu/seaice_seasonal/index.html
Should be superior to cfs per the paper mentioned on the page (skimmed it)
No product for the Canadian yet afaik.
Also has the archive of the netcdf files as far as I can tell, so you should be able to be a bit more accurate than eyeballing it, but just visually alone their 1991-2020 reference period is about 15-14.465 ~= 0.535 above the vishop mean for March for the same reference period, which eyeballing the chart below is between 14.5 and 14.6, so adjusting for the difference in datasets would bring it down to roughly 14.0, which was basically also my guess from visually adjusting down from CFS (from what I took as the bias visually from looking at the last few years… i.e. 14.2-0.2=14 was my guess last night)